

If you are working with the field of web analytics consultancy, you have probably already heard about the Google Analytics App+Web. It’s “ a new” analytics, which is now in beta testing, but which is already used by many companies. Including clients of Maks Gapchuk, an independent web analytics author of the Analytics Tips blog. As you might have guessed from the topic of the article, today he will describe the advantages of App+Web and why you need to implement this updated analytics right now.
I want to immediately answer the question that many of you are interested in. Yes, it’s free. At least for now. At the end of the article, I will give more details about the cost.
Let’s go!
The very first and most important thing. As you can understand from the name of the App+Web tool, it’s analytics that allows you to combine data from a website and a mobile app in one place. In addition, it has many other advantages that we will describe below.
New and more relevant process of data collection
Now, most businesses are working in a world where the user can visit the website many times before buying. And what is the main entity in Google Analytics? These are the sessions. And even if you remembered that there is a “user” metric, believe me, this indicator is more for show rather than really useful. And everything basic in Google Analytics is session-based.
Of course, this approach is outdated, and Google understands that. Therefore, the main focus of Google Analytics App+Web is on the user and his actions. And the main entities are User and Event.
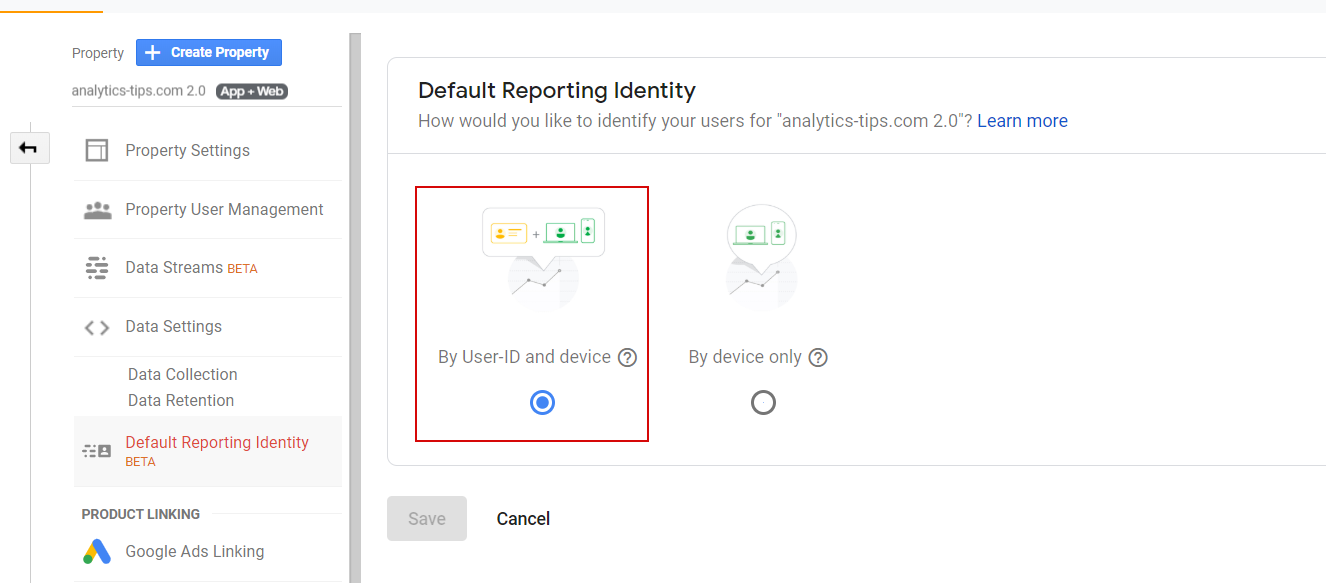
One more point about users. How many of you use the User ID view? For those who do not know, this is a view in which users are identified not based on the Client ID of Google Analytics but based on the User ID from your CRM/website admin panel. The idea, of course, is great, but the implementation could be better. In current realities, only the data with the User ID mentioned gets to this view, and others don’t.
As a result, the view contains the data on registered users only. And it turns out that we have two types of views that cannot be compared with each other: based on the Client ID and based on the User ID. There is an excellent solution in App+Web to solve this issue: now you can simultaneously use authentication by User ID, and if you don’t have one, then by Client ID.
An opportunity to collect historical data
In my opinion, this is one of the most important aspects. After all, sooner or late Google will stop supporting the current Google Analytics version and everyone will have to move to App+Web. Of course, I don’t have a timeline from the guys from Google to tell you when this happens but it definitely will. And then there will be a situation when the data in the old Google Analytics is no longer there, but the data in the new one hasn’t arrived yet.
As for me, one of the main ways of development is to compare yourself with yourself from the past to find out growth points. And you won’t have this opportunity as there is no data for the previous period. Of course, you can upload data from Google Analytics and then try to compare it but I think even without my comments it’s clear why this is not a good option. So do not hesitate and start collecting data now.
Work with raw data in BigQuery
Many large businesses are often faced with sampling in Google Analytics and they have to either do daily uploads of their data or use various tools to stream data. Google Analytics App+Web offers a more elegant solution. You can link your account with Google BigQuery and all your data will be automatically collected in this storage.
We recommend you to check the article on our blog: “What is Sampling in Google Analytics and How to Avoid It.”
By the way, you don’t need to pay for the data collection, the payment is only for storage and processing. I will also note that while registering in GCP, it’s a platform where you can find Google BigQuery among other things, you get a trial period for a year and an amount of $300. They can be spent on work with the service. For small and medium-sized businesses, this amount will be enough for a year in advance, and for large businesses, it will cost much cheaper than similar services from other companies.
Find more information about the export schema via this link.
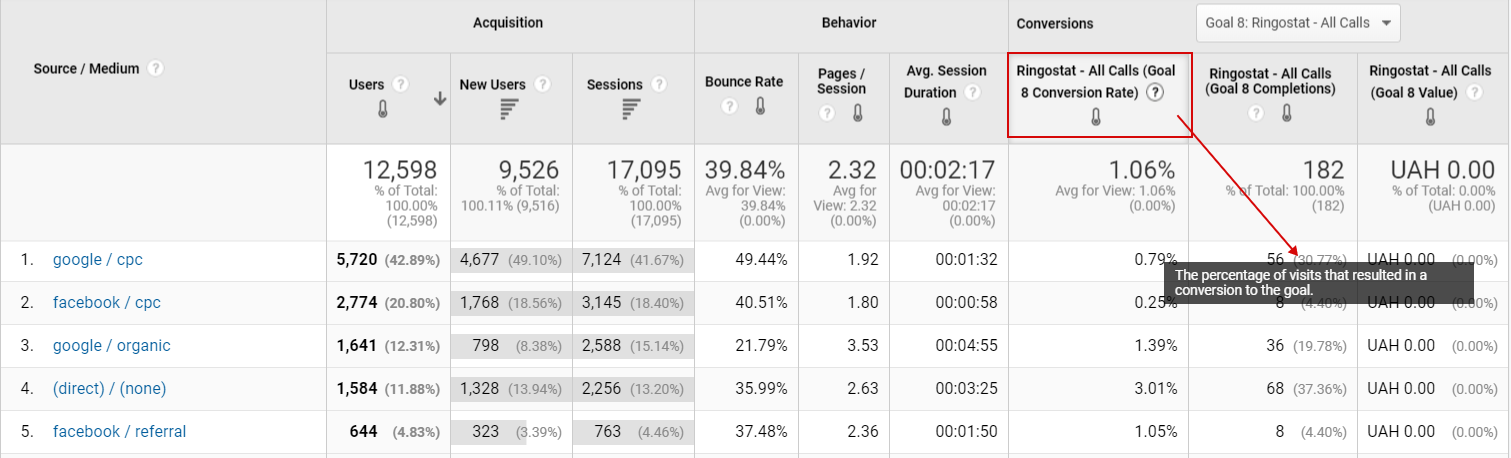
Do not forget that working in Google BigQuery opens up new possibilities. For example, now you don’t have to try to transfer data on costs from various advertising systems to Google Analytics. Now you can store them in BigQuery and they will always be near. The same thing is about call tracking data.
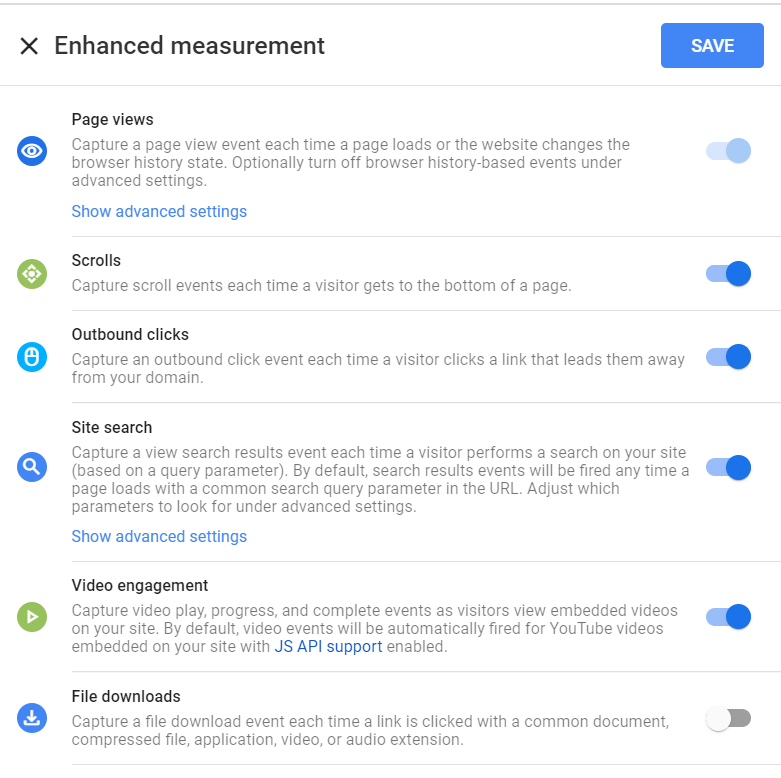
Various auto-events that are tracking in App+Web by default
The previous paragraph was more devoted to geeks who like to dig into raw data. But Google Analytics App+Web is designed not for them only. It is also created to help people who are less familiar with this tool. Now you do not need to google how to track certain basic events via GTM. Many of them are now tracked by default.
In addition to standard Pageviews, the following events are now available to marketers:
New opportunities of the interface
The innovations in App+Web do not end there. Just look at the new interface:
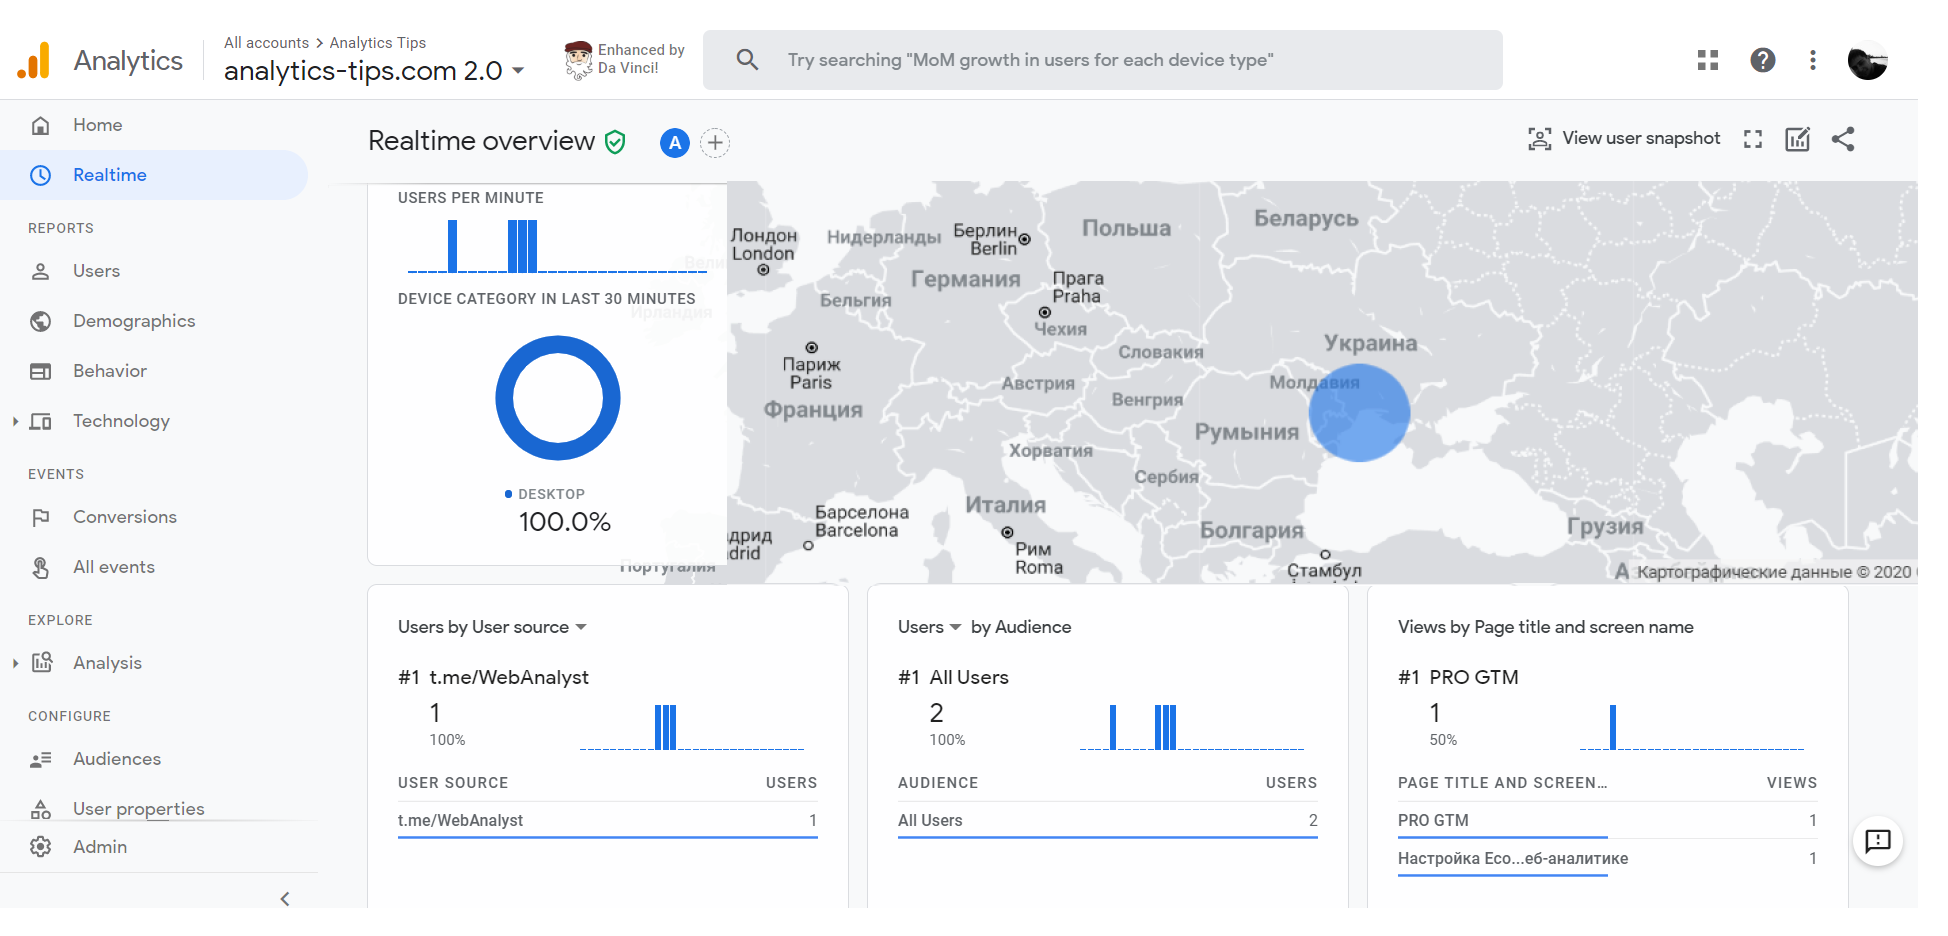
Yes, almost everything is new here. To familiarize yourself with all these things, you will need more than one article, so I will focus on the most interesting: the new report designer.
Now you have access to reports that I will discuss below.
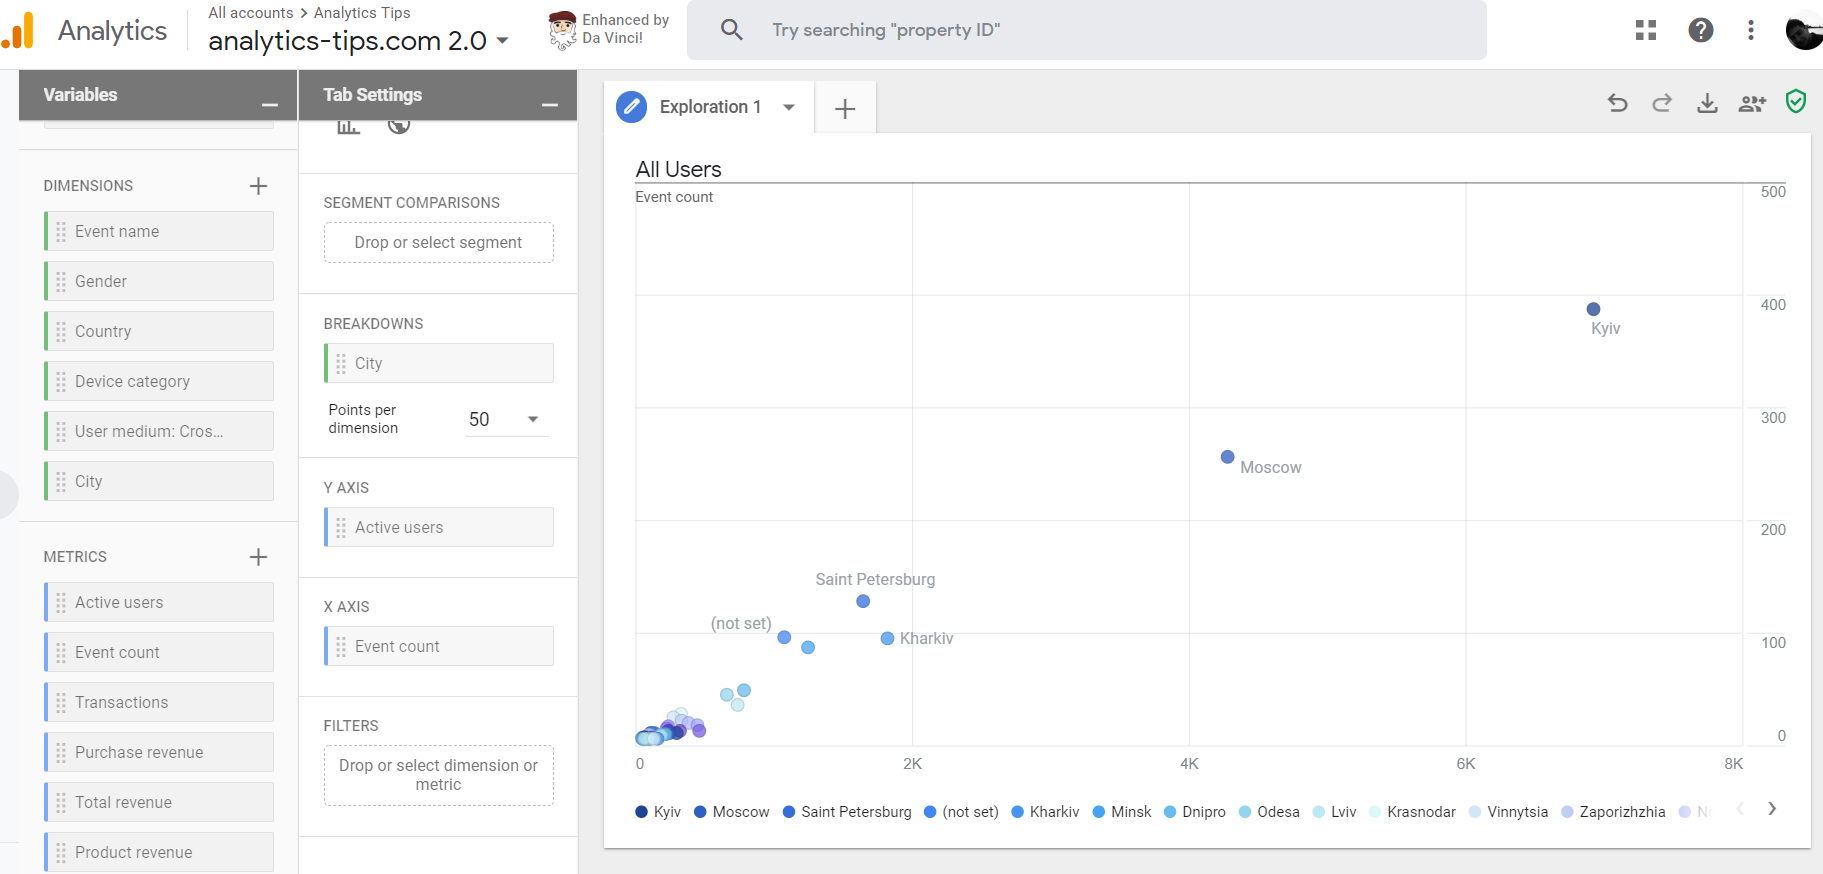
1. Exploration: allows you to study the data in more detail using various visualizations. For example, you can see a new type below — A scatter chart where we see the number of events on the X-axis and the number of active users on the Y-axis. If you wanted to examine your data from different sides at the same time, then this visualization is for you.
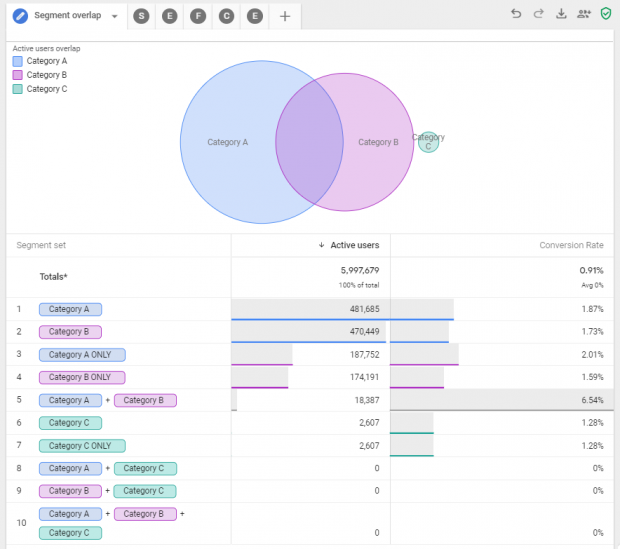
2. The segment overlap: the name of the report is rather evident — you select several segments and see their intersection. You can find more details in this article.
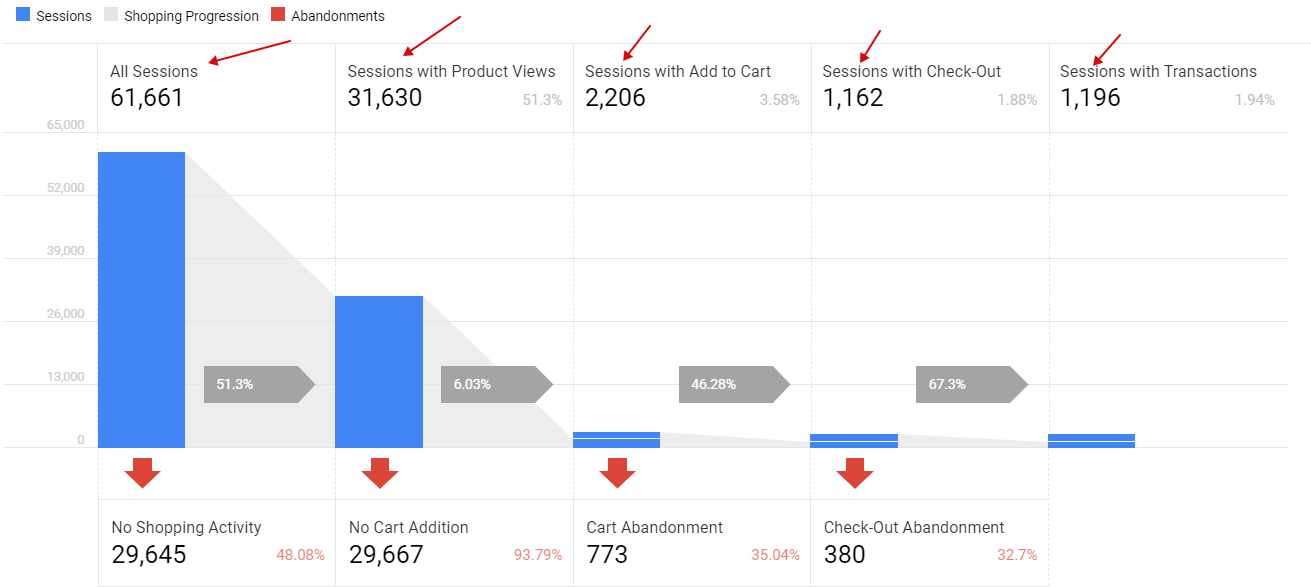
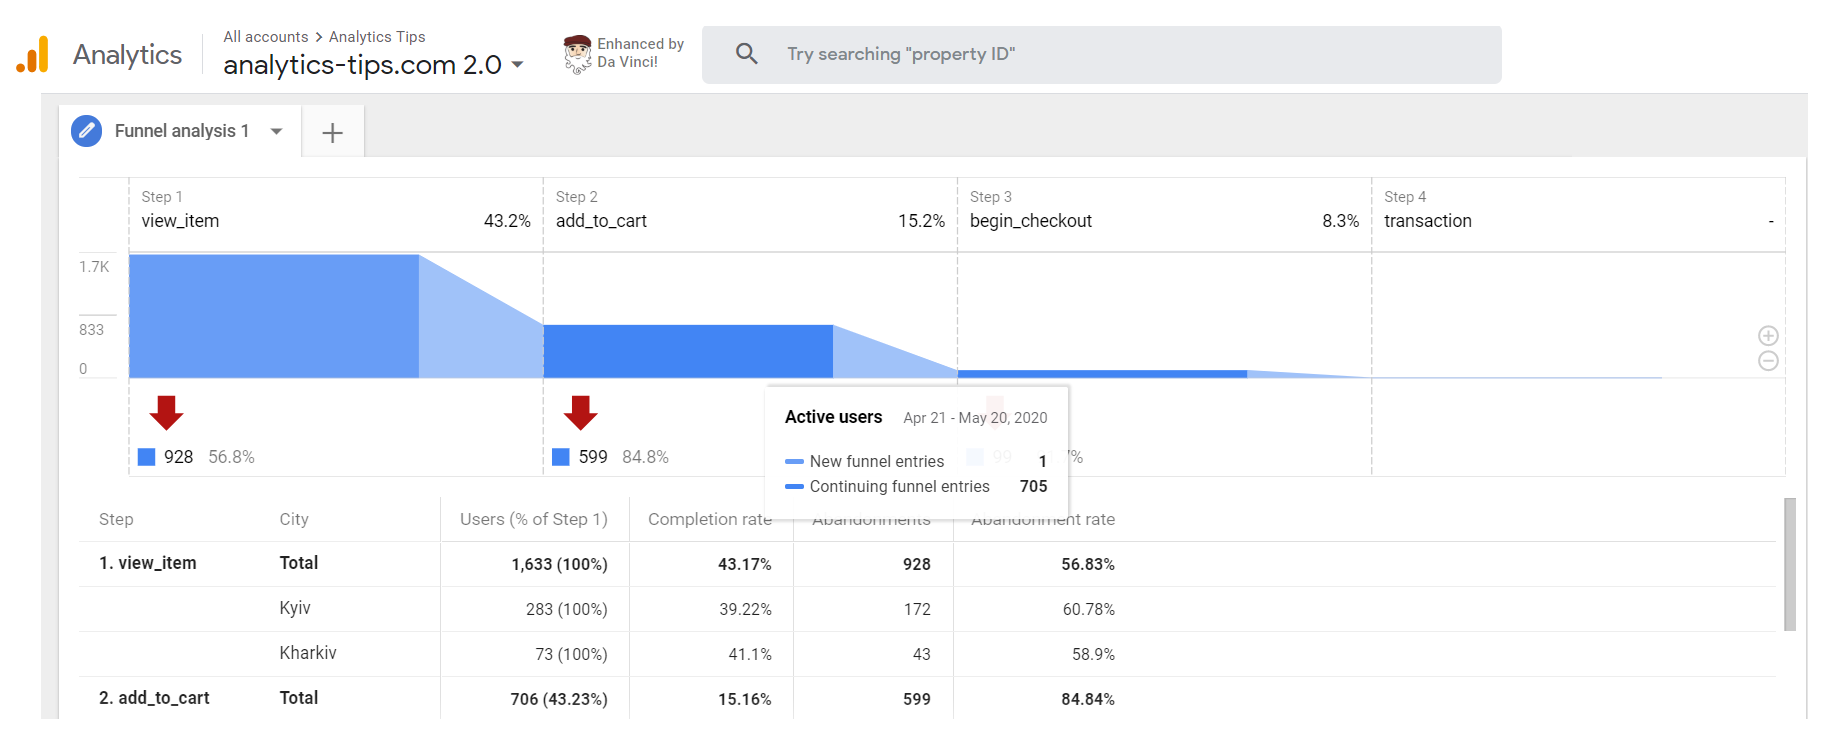
3. Funnel analysis: for me, this is one of the most anticipated types of reports. It allows you to visualize any sequential user actions on the site. For example, I visualized below e-commerce data.
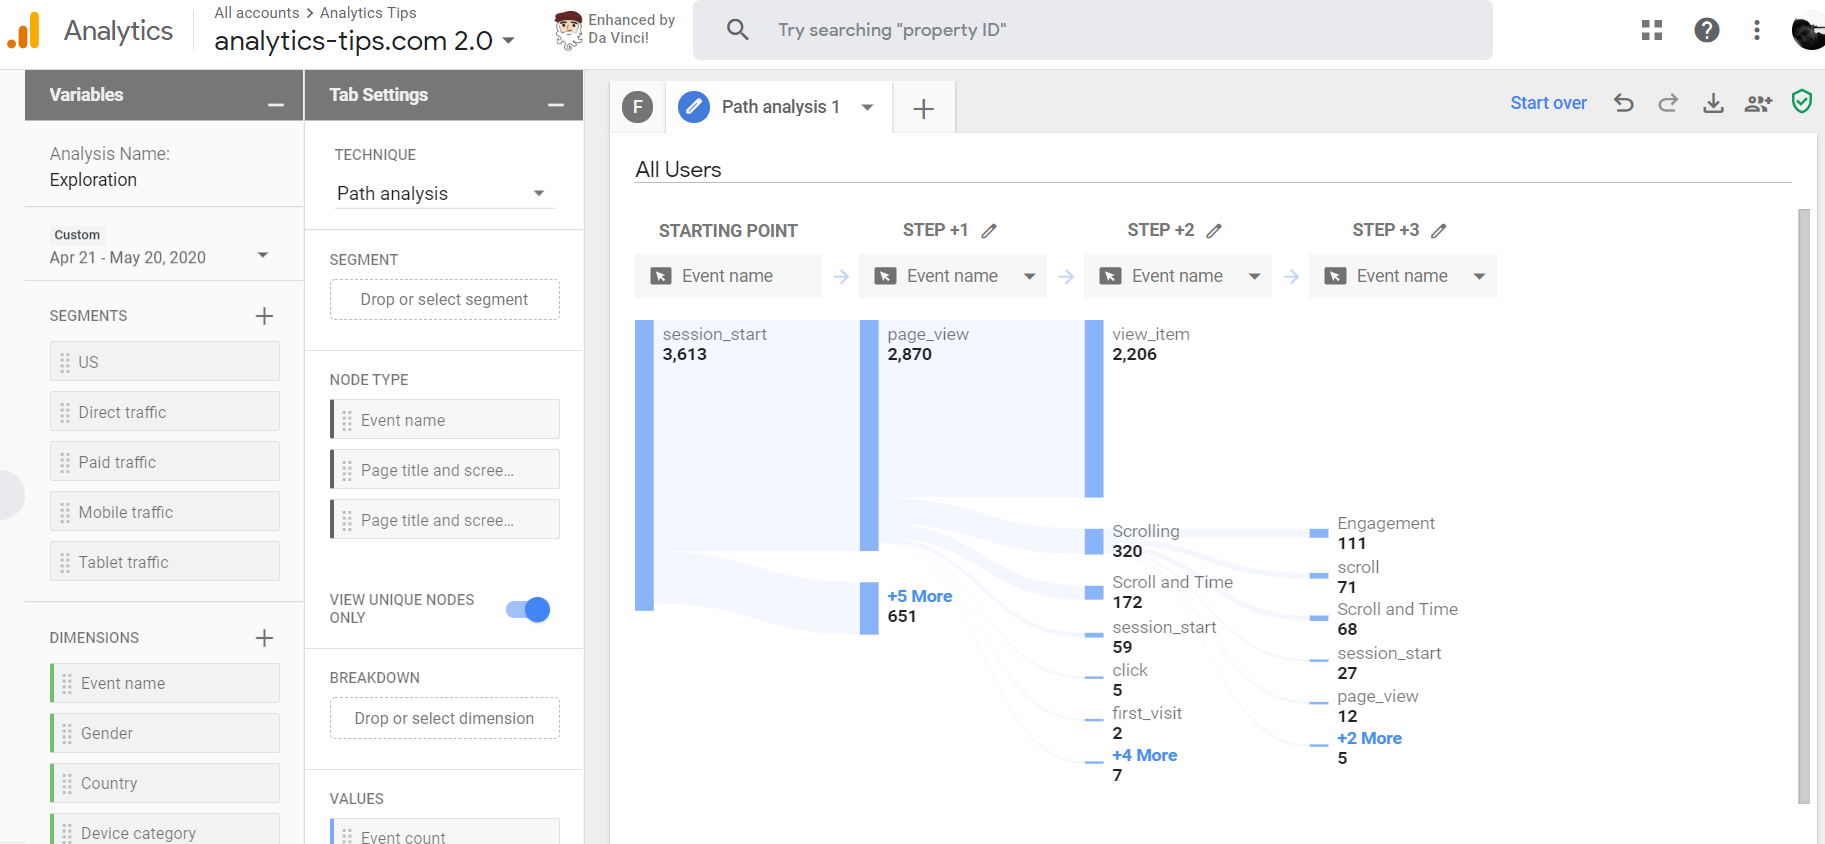
4. Path analysis: a type of report that will allow you to understand in more detail how your users interact with the website. And if in the case of the funnel you need to prescribe the steps yourself, in this report you can simply expand all the user’s paths.
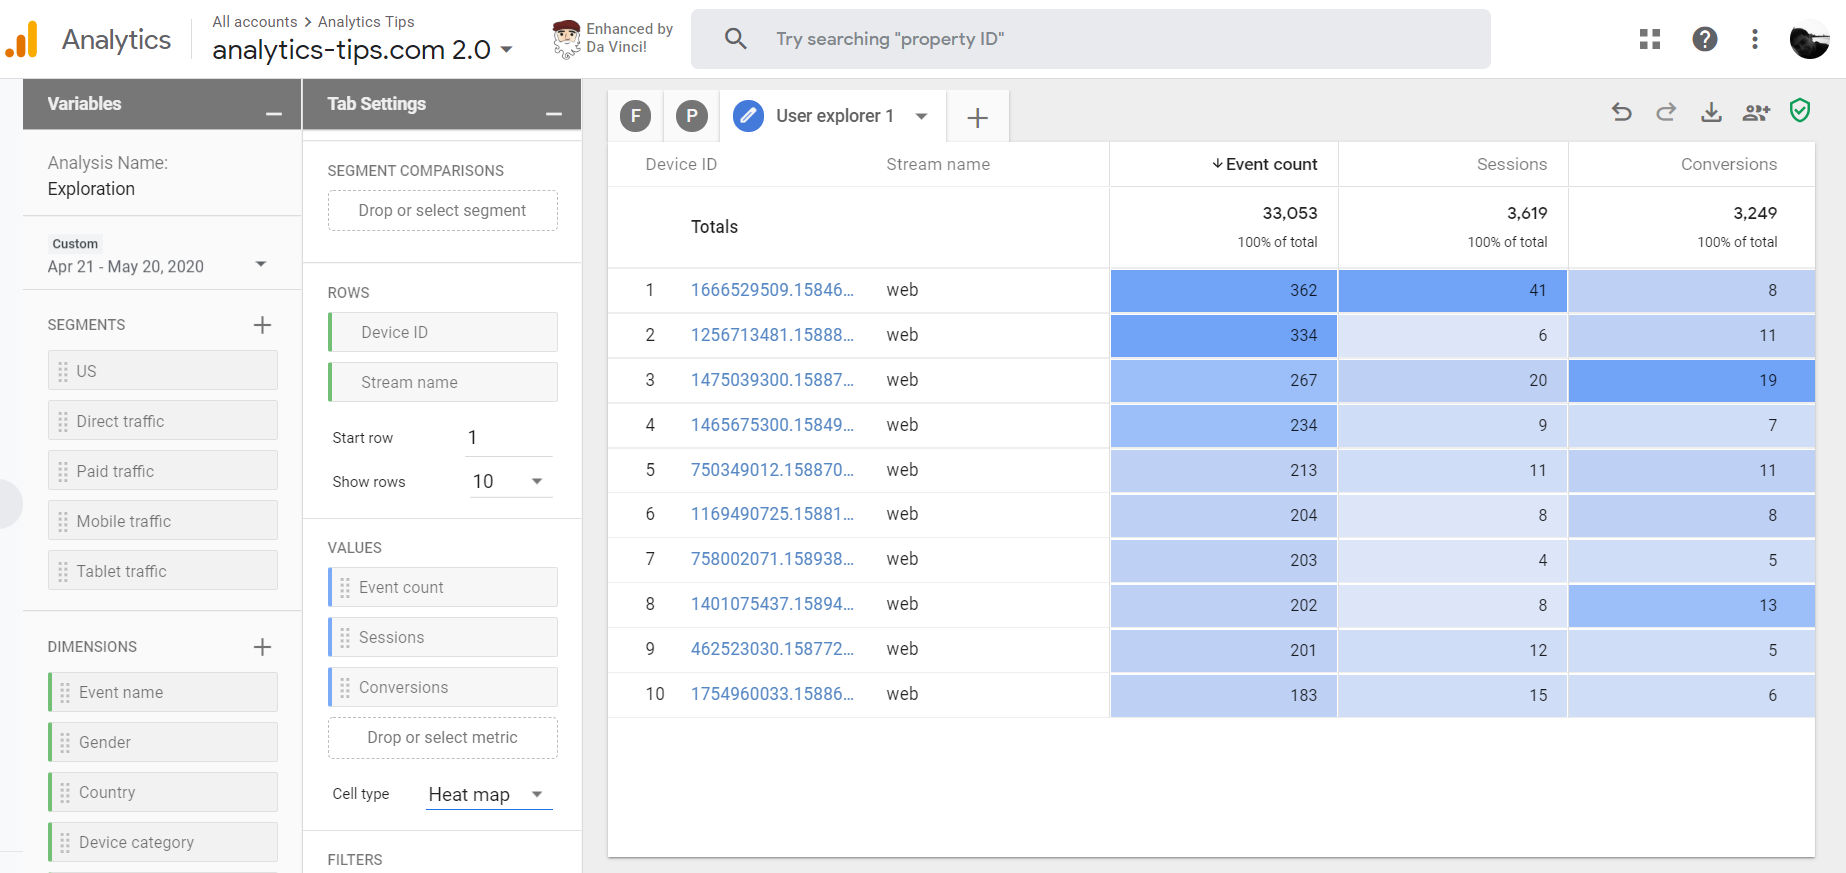
5. User explorer: the user report has also changed, and now allows you to see even more information for each of your visitors.
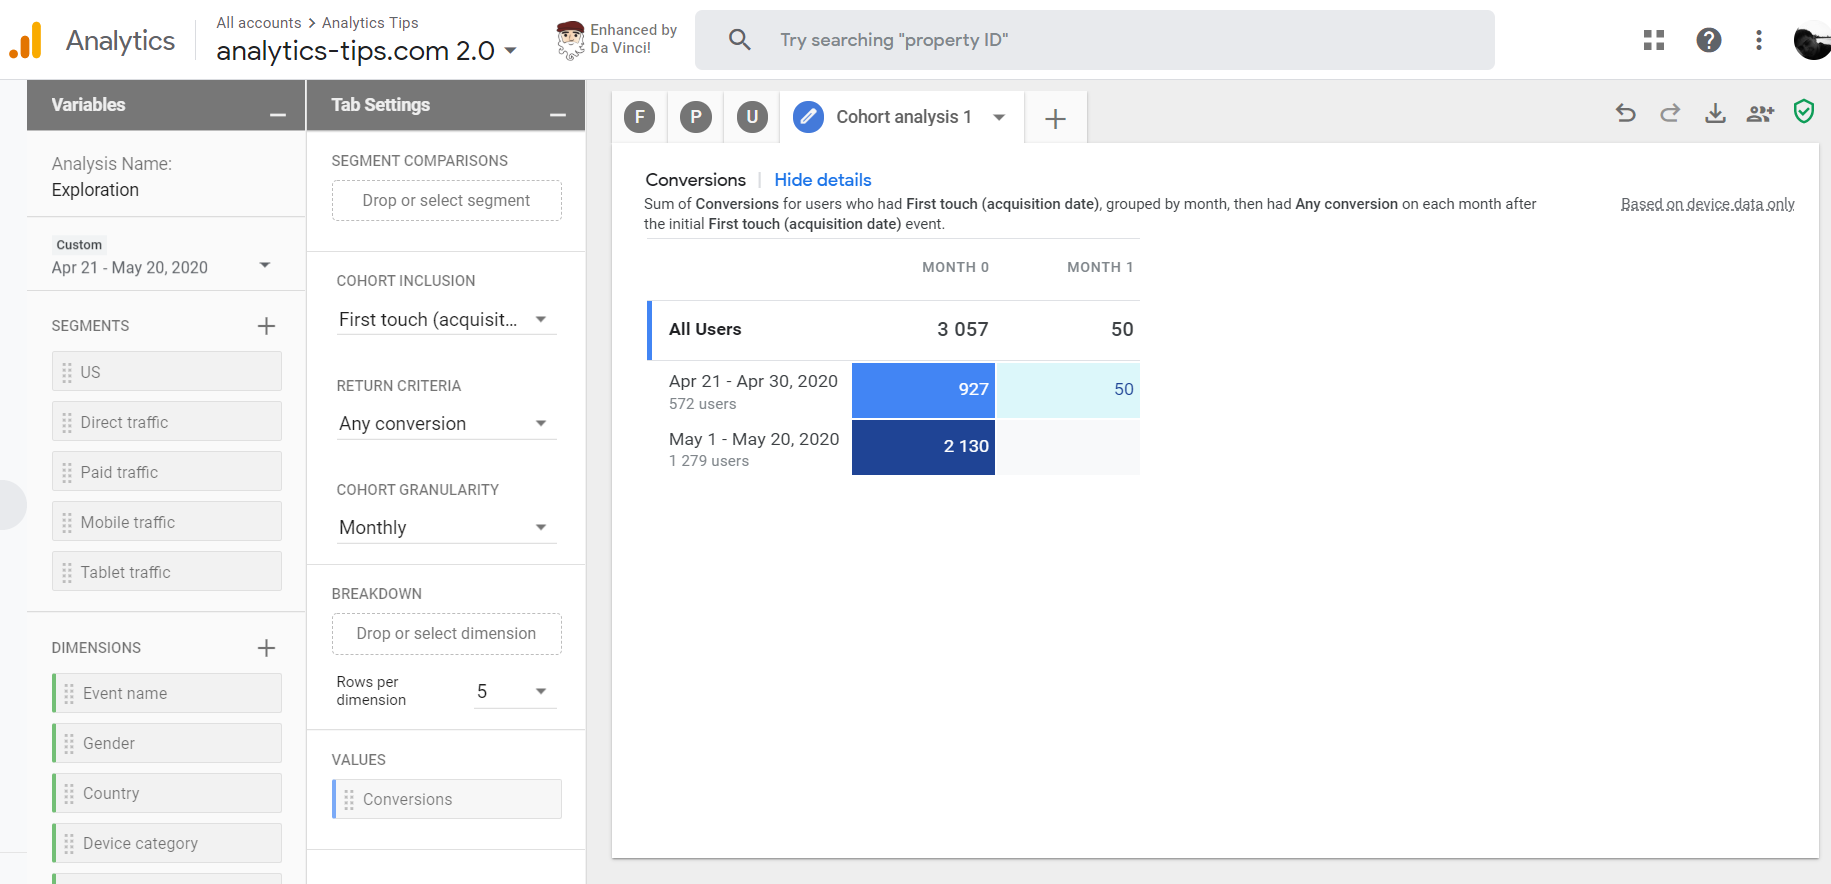
6. Cohort analysis: although this report exists in the current version of Google Analytics, it has been pretty well developed in the App+Web. And in the example below, you can see users who converted in April, and then again in May.
In this article, I have listed only a small part of the Google Analytics App+Web innovations. I hope you find it interesting to study this tool as I do, and you find it useful as well 🙂