

Sampling is a way to draw a conclusion or generalize from facts based only on a smaller sample, if you it’s not necessary to analyze all of the data for your study or research. Victor Osadchiy, OWOX BI, explains what is sampling in Google Analytics, how it can influence your business, and how to avoid sampling in your reports.
What is Sampling in Google Analytics and How to Avoid It
This method of data analysis has a long history, even before people discovered the ultimate Google Analytics tool. In various surveys, customer satisfaction tests, polls of public opinion, and most of the statistic researches. Each time sampling steps in the game, we actually get a feeling of ambiguity about how accurate are the results are of the research conducted.
Why, and when sampling happens
Google’s servers are powerful and fast, but even they sometimes can’t handle processing overwhelming amounts of data in seconds. That’s why Google Analytics applies sampling to balance accuracy with the speed of processing information, and give you the reports you’ve requested the same fast.
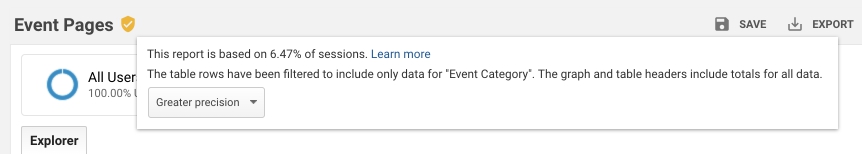
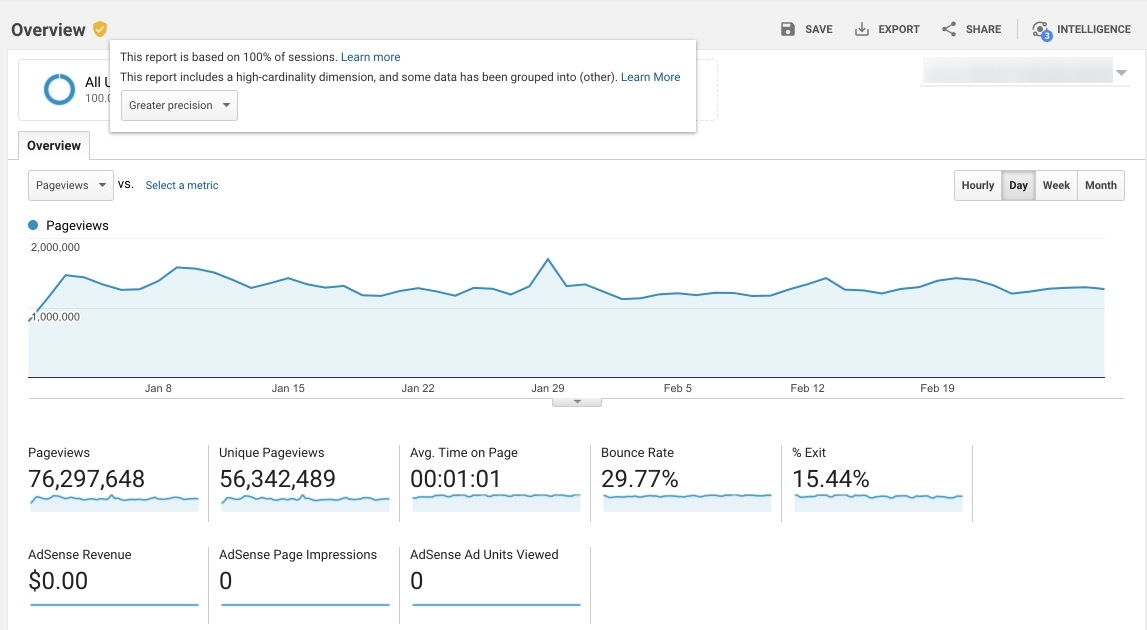
When this happens, you can see it by checking the top left of your Google Analytics report. Every time you get a message that your report was built using 99% of sessions or less, the data was sampled for sure. In most cases, your data is sampled because there are over 500,000 sessions in the data amount for date range you selected.
Default & Ad-hoc reports
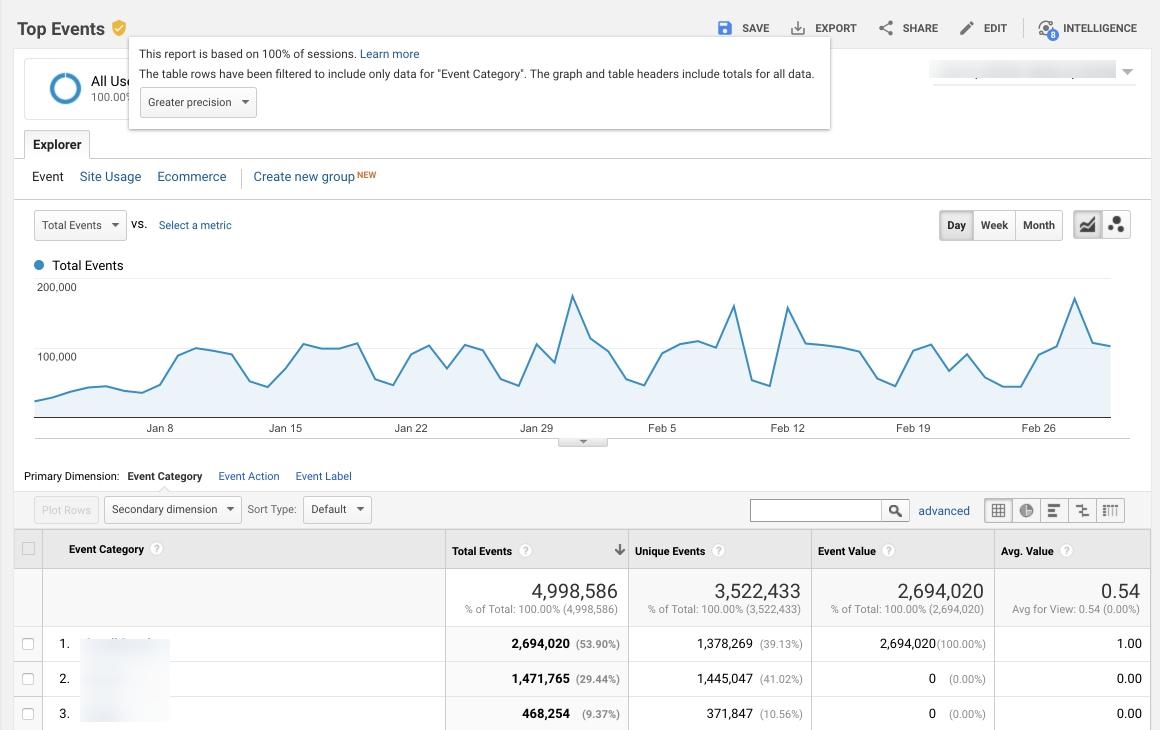
The data is unsampled in most of the default Google Analytics reports. Google pre-aggregates the tables of this data for each of the reporting views, creating preset combinations of dimensions and metrics based on complete information. Such datasets get processed every day, meaning you obtain calculated and updated data for your analysis in default reports. See an example of a report that was based on complete data:
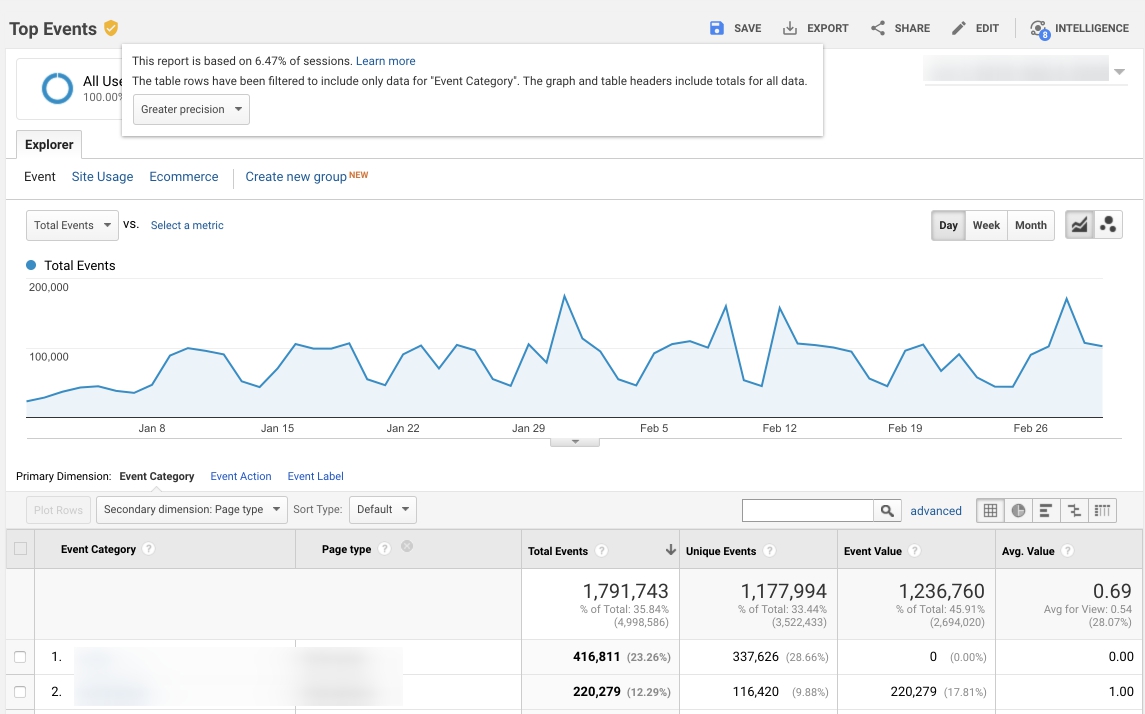
Though, if you modify the default report with a segment, a filter or a secondary dimension, Google Analytics issues an ad-hoc report, to give you the info you need. Custom reports also lead to the same thing each time you combine additional dimensions and metrics that weren’t included in the default report. Google Analytics first checks if there’s the info you’ve requested in the pre-aggregated tables of data. In case there isn’t, Google Analytics queries raw data to provide you with the necessary report. If there are over 500,000 sessions within the data range for the analysis, ad-hoc reports might contain sampled info.
Check out an example of a report with sampled data:
Flow reports
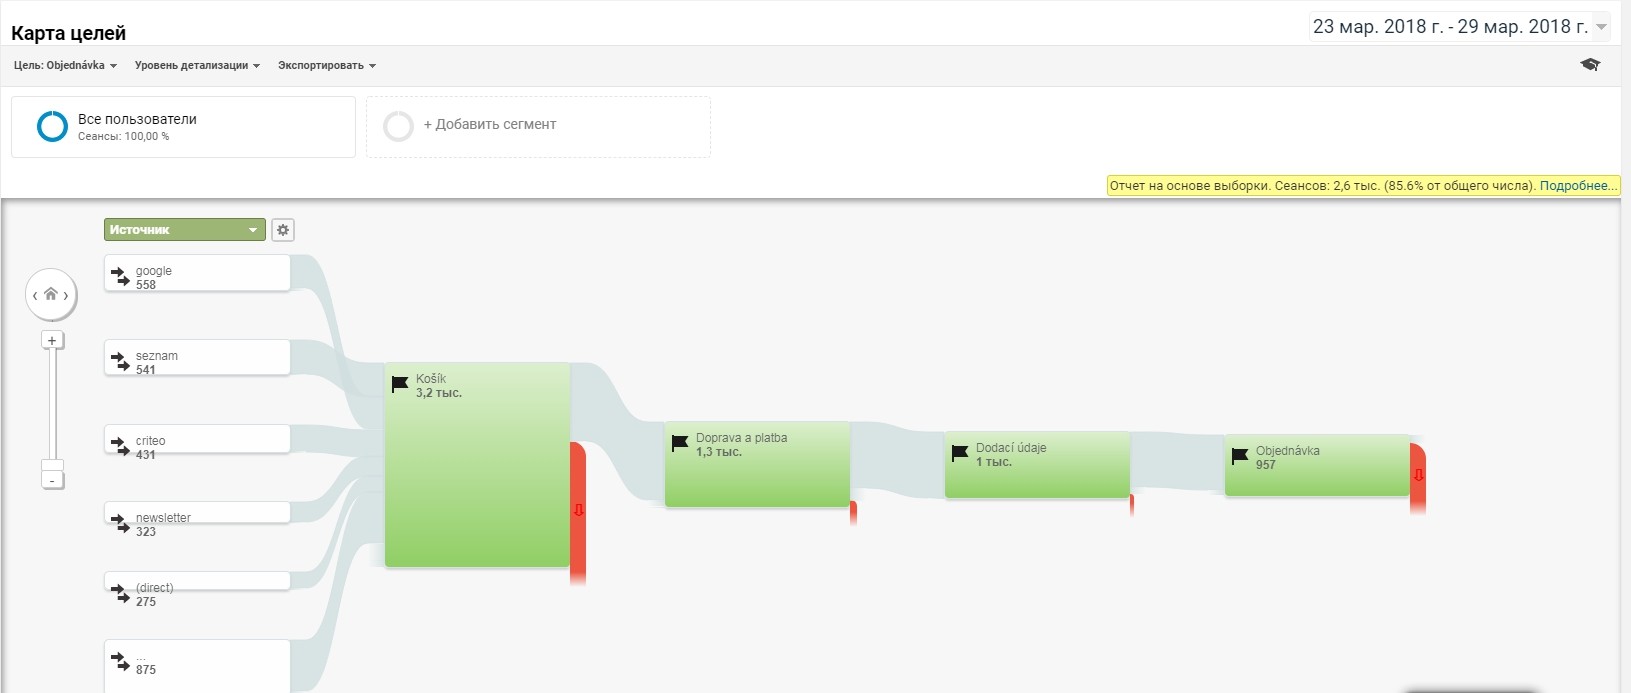
When it comes to the flow-visualization reports, like Behavior Flow, Users Flow, Goals Flow, and Events Flow, Google Analytics sampling threshold is only 100,000 sessions max. If more, the data always gets sampled.
Unlike in default reports, Google Analytics uses a different sample set to create flow-visualisation reports, so you might find some discrepancies in the metrics presented. As a result, in the Behavior Flow and Goal Flow reports, you’ll see the total number of users, visits, etc. that are different from info in the default Behavior and Conversion Overview reports.
Here’s an example of a flow report:
Multi-Channel Funnel and Attribution reports
Sampling is never used in Multi-Channel Funnel and Attribution reports, if you don’t modify them. If you do, Google Analytics will only show a 1,000,000 conversion sample.
Why sampling can be a trouble
Sampling size matters. If 90% or more data about your sessions are used, you may not worry about the data reliability. Though, the accuracy of your data decreases when the data sample for analysis shrinks. If there are 1,000 sessions in your report that was based on just 1% of data, the results were obtained by multiplying 10 sessions by 100. This means you know nothing about the other 990 sessions, which is 99% of all your data! How do you trust data, if you don’t see the big picture?
Remember that video ad saying that 8 out 10 housewives prefer using a certain washing powder? How was the survey organized and how do you make sure that these 8 ladies weren’t specially picked as certain brand fans? You usually don’t, but your mind automatically recognizes 8 out of 10 as 80%, which makes you believe the majority of people also prefer this washing powder.
Sampling in Google Analytics creates the same impression of reliability. However, when you’re only looking to check the number of sessions, it may be fine for you. But if measuring revenue, conversions or goals, sampling may cause some money losses. Due to the sampled data you can get some metric values that are distorted, making you think invest more in campaigns that underdeliver, or, alternatively, believe that some of the ads drive in more revenue than they actually do. Any of the options lead to unfortunate money loses.
How to get rid of sampling
Before choosing the way to do this, think about the sampling percentage that is ok for your business. If it’s much higher than you can tolerate, we’ve numbered the options to minimize or get rid of sampling below.
Within the Google Analytics interface
We’ll start with the least efforts required.
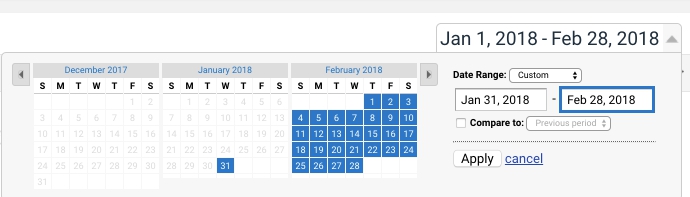
1. Make the date range of your report shorter, to keep under the sampling threshold
The longer the time span, the higher the probability of Google Analytics using sampling, as the data volume for processing grows. So why not reduce the server load and decrease the risk of sampling, by shortening the selected date range?
For instance, there are less than 500,000 visits to your website a month and you would like a report on, say, 6 months. Instead of a single report for half a year, you can create 6 reports, one for each month. In this case, every of these reports will base on complete unsampled data.
2. Don’t resort to ad-hoc reports
We’ve already mentioned that default Google Analytics reports provide you with calculations based on complete unsampled data. So, if you somehow overcome the temptation to customize your reports and stick to the default ones, your information will remain accurate. Just make sure you don’t apply any segments or secondary dimensions in reports!
For example, you’d like data on the traffic to your site from organic search. If you want info based on 100% of session, don’t apply the Organic segment to the report on Landing Pages. Instead, check the report on Organic Search under Channels, using Landing page as the primary dimension.
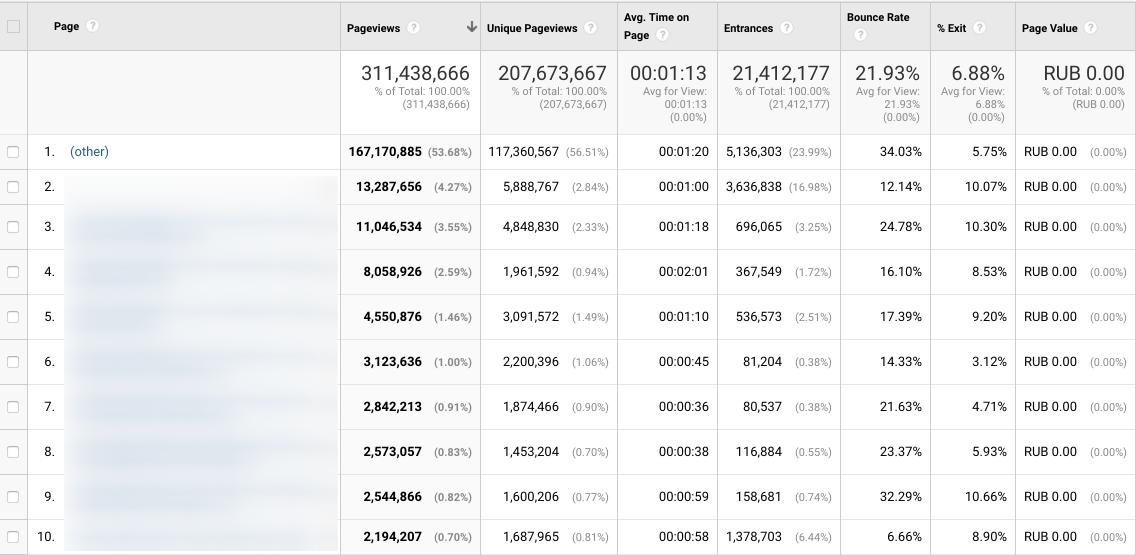
You should also keep in mind that Google Analytics has a 50,000 row limit a day, to display in reports that were built upon pre-aggregated data. Though, the limit for ad-hoc reports is 1,000,000 rows a day. When exceeded, all the values over the limit get grouped in the (other) row.
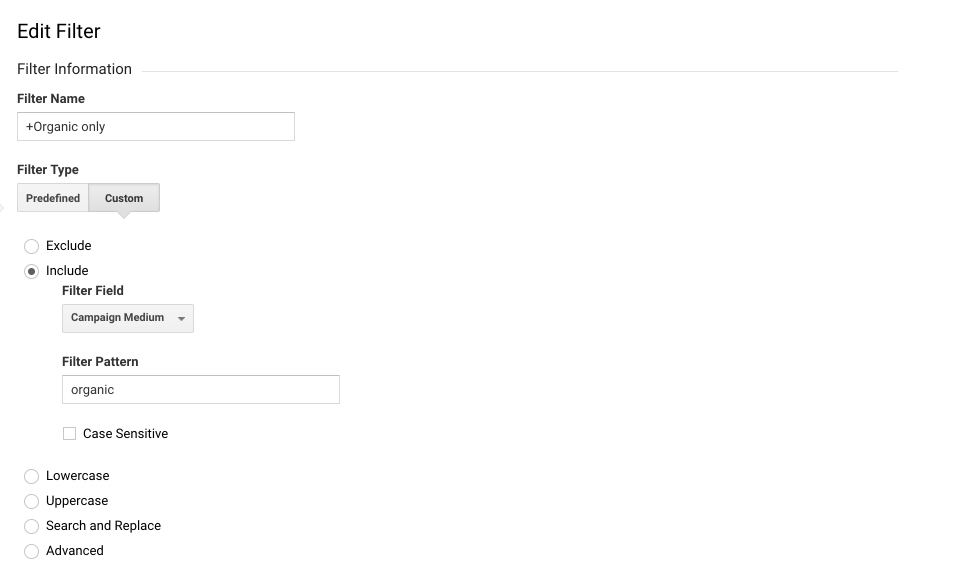
3. Use view-level filters to show only the data you need most often
All of our data in Google Analytics gets sampled at the level of views as soon as we apply view-level filters. To be more precise, the service only uses the sessions that are approved by a filter, to build a data sample for analysis.
Let’s get back to the example, when you need info on the Organic search traffic leading to your site. Say you need it quite often, so you can create a duplicate view with a view filter to only see the organic traffic. This will surely lead to reducing the sampling percentage in ad-hoc reports, while there will be no sampling in default reports.
We advise avoiding filtering your data by using page-level dimensions. For example, this may cause troubles for Ecommerce website with multiple categories of product and numerous pages. In case you apply a different view for every type of your pages, one user’s sessions will be split across different views, and the total session number will surely be overstated.
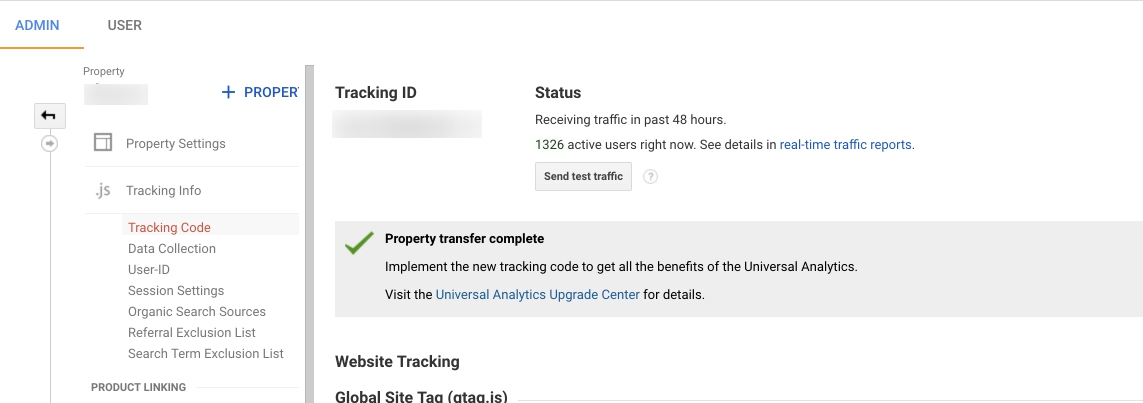
4. Use a different Property to track every of your sites
Tracking all of the websites we have in one Google Analytics property is quite common. We simply apply filters to check the info on one of your sites. However,the more data in a single property means higher risk of sampling. As an option, you can create a separate view for each of the websites, reducing the data volumes and decreasing the Google Analytics server load, as well as sampling chances.
Outside the interface of Google Analytics
Let’s talk about more advanced ways of fighting sampling by exporting your data out of Google Analytics. However, you can’t get raw demographic data out of Google Analytics, as it always gets aggregated within the system.
5. Try Google Analytics API
This is how you can access your data in a programmatic way. The API actually applies sampling for a long span of time, though you can choose the data volume you need to get and also specify the sampling percentage. However, this is not the best option If you have a highly popular website with a lot of traffic, as you’ll have to run hundreds (like really, hundreds!) of requests to get the necessary data extracted. You can send not more than 50,000 requests per project a day, and get up to 10,000 rows of information for a single request.
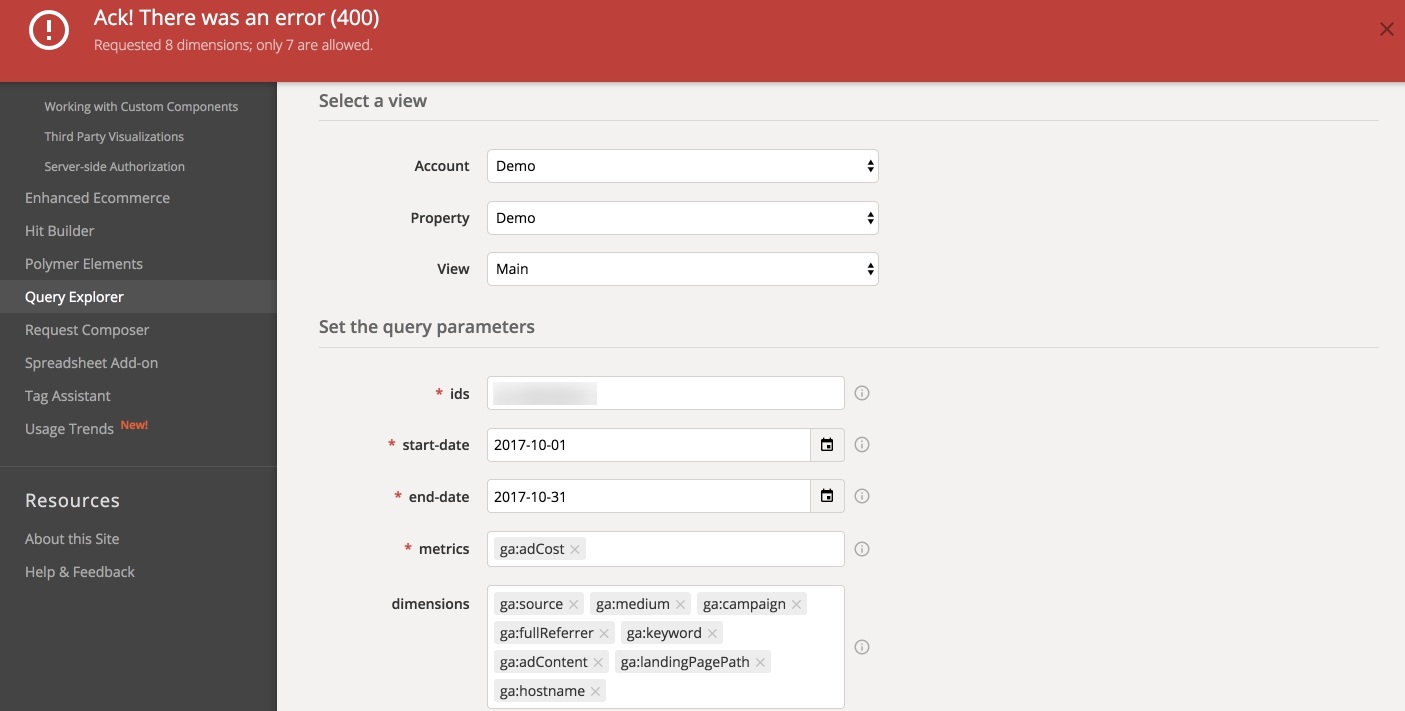
This solution sounds pretty good, but it requires programming skills and a lot of time. Why? Because it’s difficult to run so many requests with your own hands. You’ll have to automate the process with the help of coding. Moreover, you’ll be able to combine only 7 dimensions with 10 metrics for one query. Not all dimensions can be used together in a single query, and each of the requests should contain at least one metric. You can get more info about the API here.
See what happens if you try to use more than 7 dimensions:
6. Use Google Analytics Spreadsheet add-on
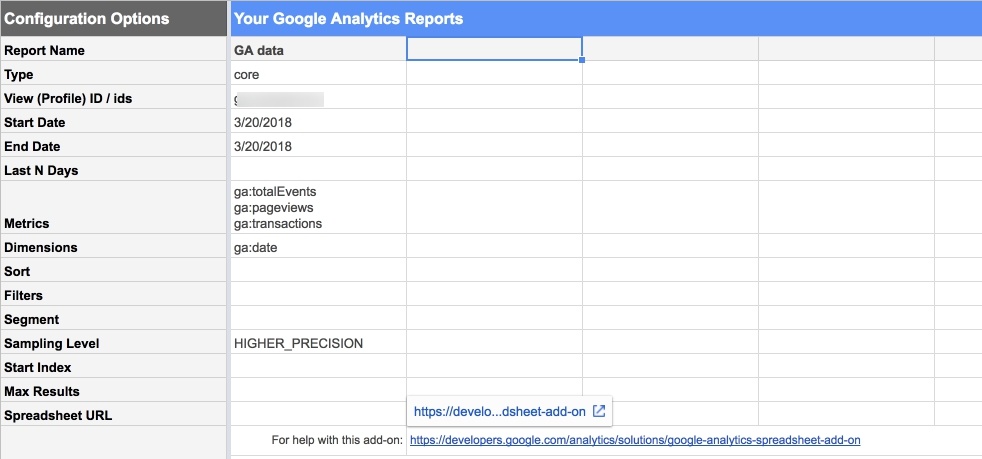
If coding is not your thing, try the official addon. It will actually resort to the Google Analytics Reporting API, helping you to send a query to Google Analytics data and export it to Google Sheets. You’ll be able to extract your data automatically from multiple Google Analytics properties, run calculations, visualize your information and share the visualized data with others. Oh, and this way you’ll be able to apply 9 dimensions.
Still there are some drawbacks, as Google Sheets allows only a maximum of 400,000 cells (for now) across all sheets in a spreadsheet. What’s it to you? Actually, this means that you won’t get to work with really big data amounts:
7. Invest in Google Analytics 360
Yep, Google Analytics 360 is definitely more advanced in question of sampling:
- sampling threshold of 100 million sessions for a single view;
- reports that are not sampled with up to 3 million unique rows of data that you can run any time or schedule;
- custom Tables with up to 1 million rows a day, with the access to non-sampled data, up to 6 dimensions, 25 metrics, 5 filters, and 4 segments in a table.
Moreover, Google Analytics 360 has a native integration with Google BigQuery. This allows you to export unsampled, hit-level, near real-time data from Google Analytics to BigQuery, and use SQL queries for more advanced and complex reports in just a couple moments.
The solution is great and stands for a good fit for businesses with big budgets. Before switching to the premium subscription, make sure that sampling is often an issue for you, your there are 10 million hits on our website each month, and the license is affordable for your company.
8. Use OWOX BI Pipeline
OWOX BI Pipeline provides a way to avoid sampling without having to invest in Google Analytics 360 or spend your company’s resources on coding an API solution. The tool allows you to harness the power of Google BigQuery to collect Google Analytics data, except the data will always be raw and collected in near real time. Since OWOX BI uses its own algorithm to compute sessions, the data will always be unsampled, no matter how many sessions you have in your Google Analytics. Take about 10 minutes to implement the tool, and it will do the rest. You can try OWOX BI Pipeline for free with a 14-day trial.
If you’re not ready to invest in the Google Analytics 360 license yet and don’t want your team to spend time on coding, try OWOX BI Pipeline. This tool lets you collect raw unsampled Google Analytics data in near-real time by means of Google BigQuery. With the special OWOX BI algorithm for session data collecting, sampling is never an issue, and it takes only minutes to implement BI Pipeline in your business.