

Everyday, people upload 700,000 hours of content to YouTube. If you do not promote and optimize your content properly, it risks being overlooked even by your most enthusiastic subscribers. When you perform analytics on your channel and content, your content has a better chance of getting noticed and watched, which will lead to more subscribers and ad revenue. David Campbell, marketing specialist at Ramp Ventures and Right Inbox, talks about useful metrics for high results.
YouTube Analytics provides you with insights that can help you create engaging content and grow your audience. It categorizes different metrics into overview, reach, engagement, and audience. With dozens of data points, picking the right metrics to track can be quite overwhelming, particularly for content creators who do not have much experience with analytics.
Many content creators also get confused by different terms. For example, they might not know the difference between an impression, a view, and a click-through. To them, views are all that matter, not knowing that all three metrics are interconnected.
This article will introduce you to eight crucial YouTube Analytics metrics that will help you discover just how well your content is performing. Read on to know what these metrics are and how they can help you create content that converts.
Watch Time
Many YouTube channel owners and marketers consider view count as a critical success metric for videos. But view count doesn’t give a complete overview of your video’s performance. It has a limited impact on YouTube’s algorithm because view counts don’t reveal engagement.
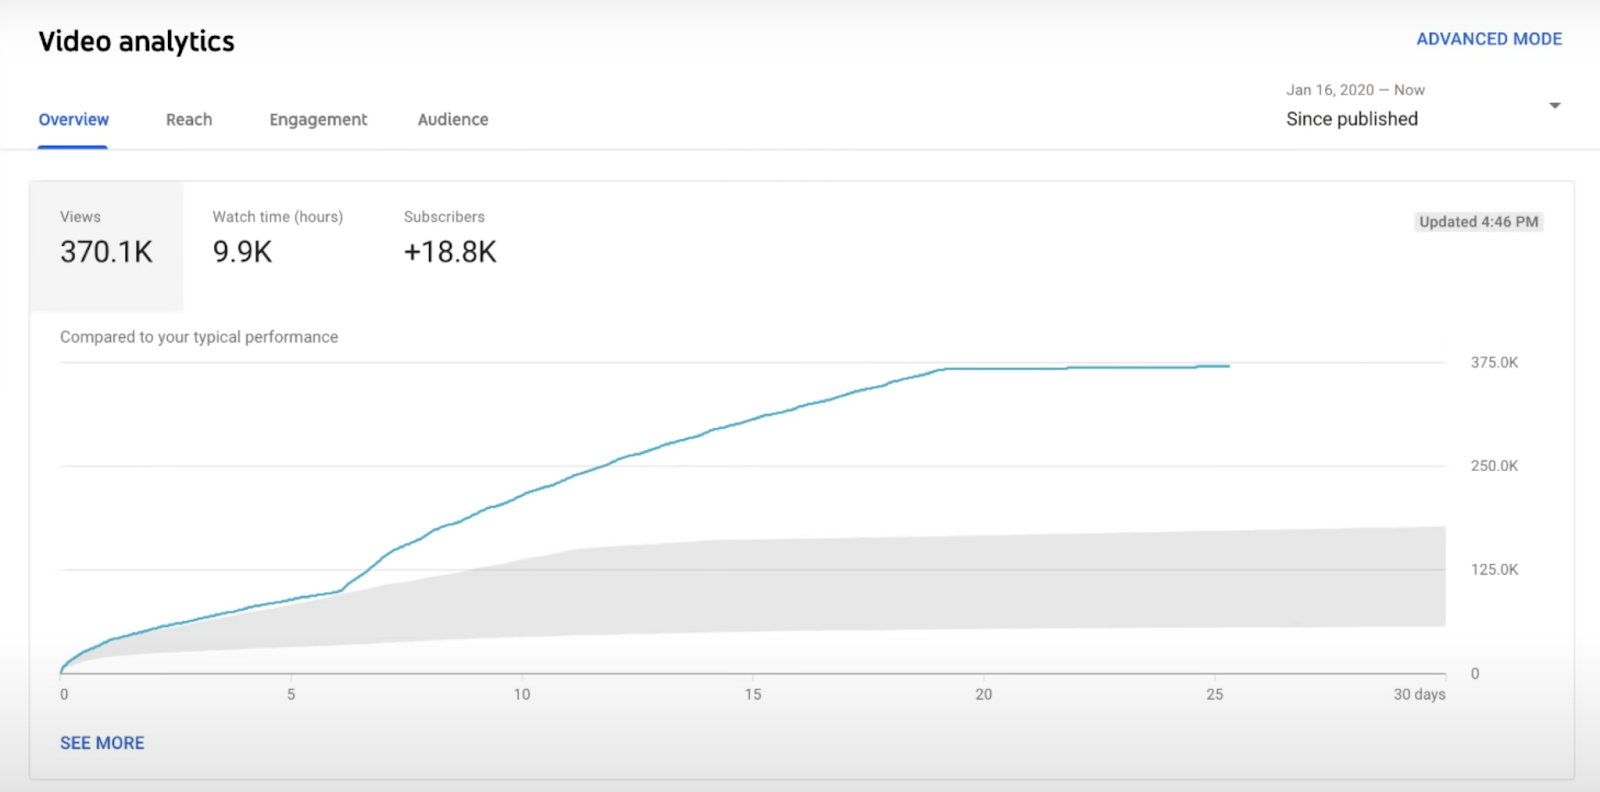
Rather than focusing on view counts, you should monitor the watch time. The watch time equals the total and average time people spent watching any of your videos.
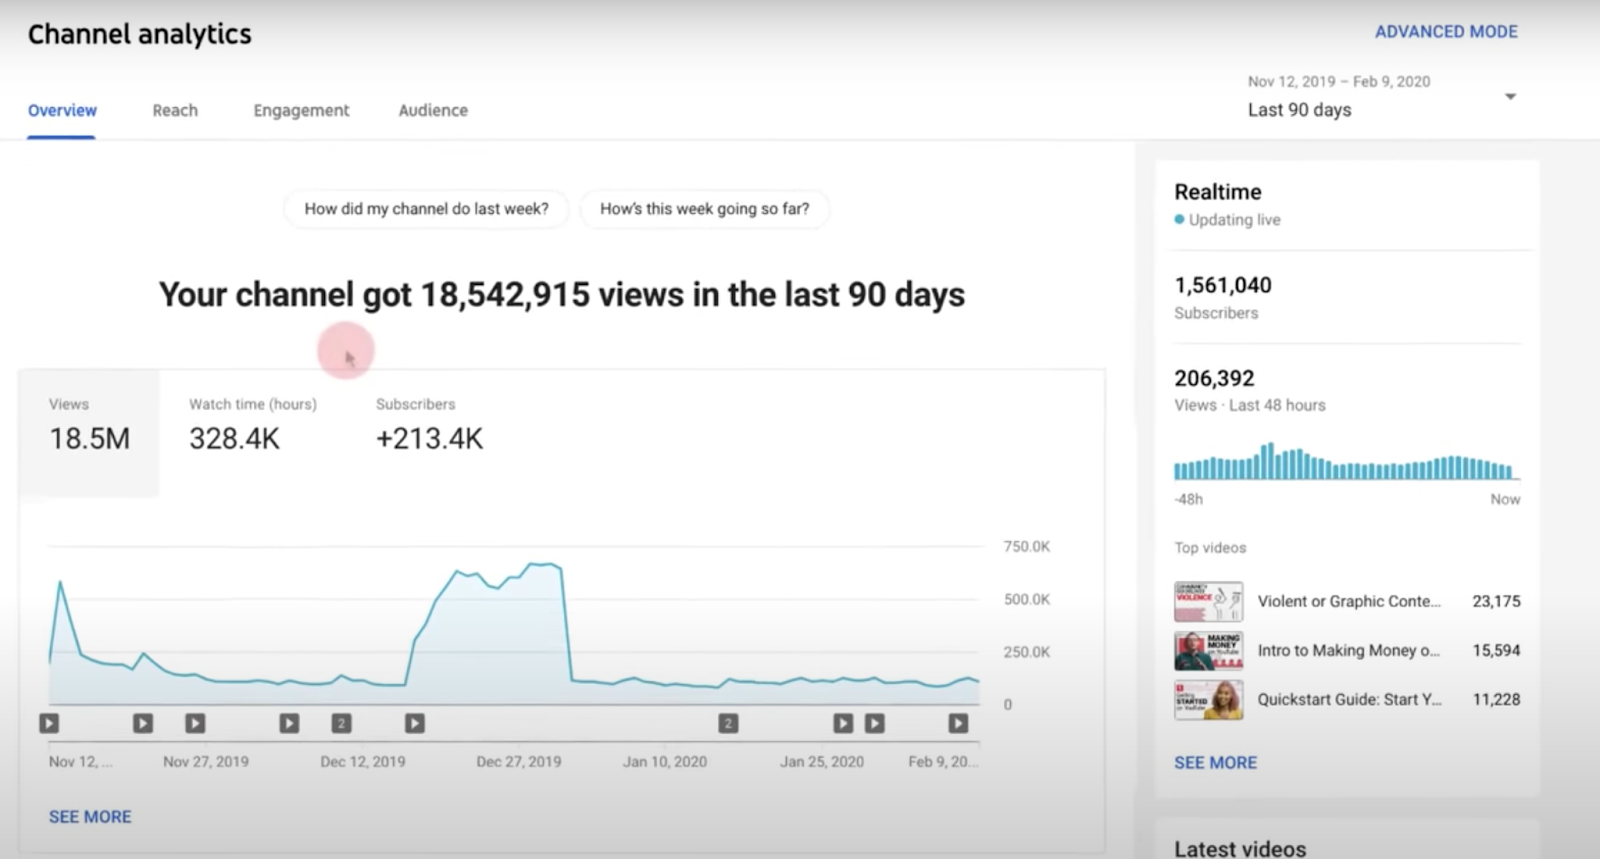
The latest YouTube Analytics dashboard dedicates a separate section to watch time. When you analyze watch time, look at variables like video duration, style, and theme to narrow down the analysis.
When your videos have a high view count but low watch times, there can be:
- Production-oriented – editing software and cameras
- Content-oriented – not attractive enough to engage viewers
If you’re facing either of these problems, you need to work on a solution.
There are various strategies you can try to improve watch time.
- Try live streaming: Going live is a powerful strategy for increasing your core audience engagement. People who are more engaged with your channel are more likely to watch your posted content through to the end.
- Set your viewers’ expectations: A clickbait title and thumbnail can boost your views, but once your audience realizes they’ve been had, they are going to leave right away. Using accurate titles, descriptions, and thumbnails will attract the attention of viewers who can commit to watching a significant part of your video.
- Tease your audience: People have short attention spans. If they don’t see anything interesting right away, they’re going to shift their attention elsewhere. You can reduce this by showing the most exciting part of your message right away and encouraging your viewers to watch till the end.
- Add your video to playlists: Many YouTube content creators don’t know that their watch time doesn’t just depend on people watching their own content. If your video is part of a playlist and a user stays on that playlist after watching your video, you’ll still get credited for the time the user spends on other videos in the playlist.
YouTube channels with a high watch-time tend to rank on the top of search results.
Audience Retention
Audience retention is a qualitative determinant of your YouTube videos’ views. There are two tabs on the audience retention report: absolute retention and relative retention.
Absolute retention evaluates the viewing style of a particular video. The graph shows you how long people have engaged with your content. The data helps you assess viewer actions like skipping the intro or not watching your entire video.
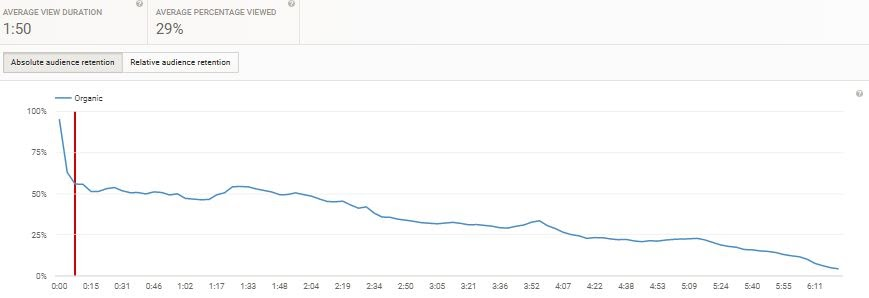
In the absolute retention report above, we can see that half of the people who viewed the video bounced, or left the video, after the first few seconds. This could indicate that the viewers lost interest in the video, possibly because the video didn’t show the content that they expected or because the video took too long to get to its main point.
On the other hand, relative retention assesses the viewing style of your video compared to other same-length videos uploaded on YouTube in your niche. You can evaluate your viewer engagement against a broader average for videos of similar durations using relative retention.
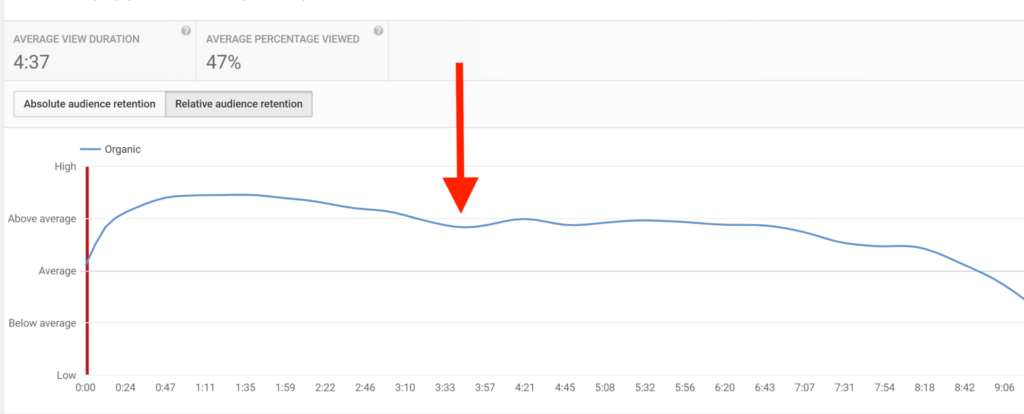
The largest difference between the absolute and relative retention reports is that the latter uses a scale that goes from “low” to “below average” to “average”, “above average”, and “high”. This implies that compared to similar videos of the same length and niche, your video performs better or worse at specific time stamps.
You can only assess one video at a time through the audience retention rate dashboard, which means you can’t make direct comparisons between two or more videos. Nevertheless, the audience retention rate is an extremely important metric that helps you identify issues with your content.
Engagement
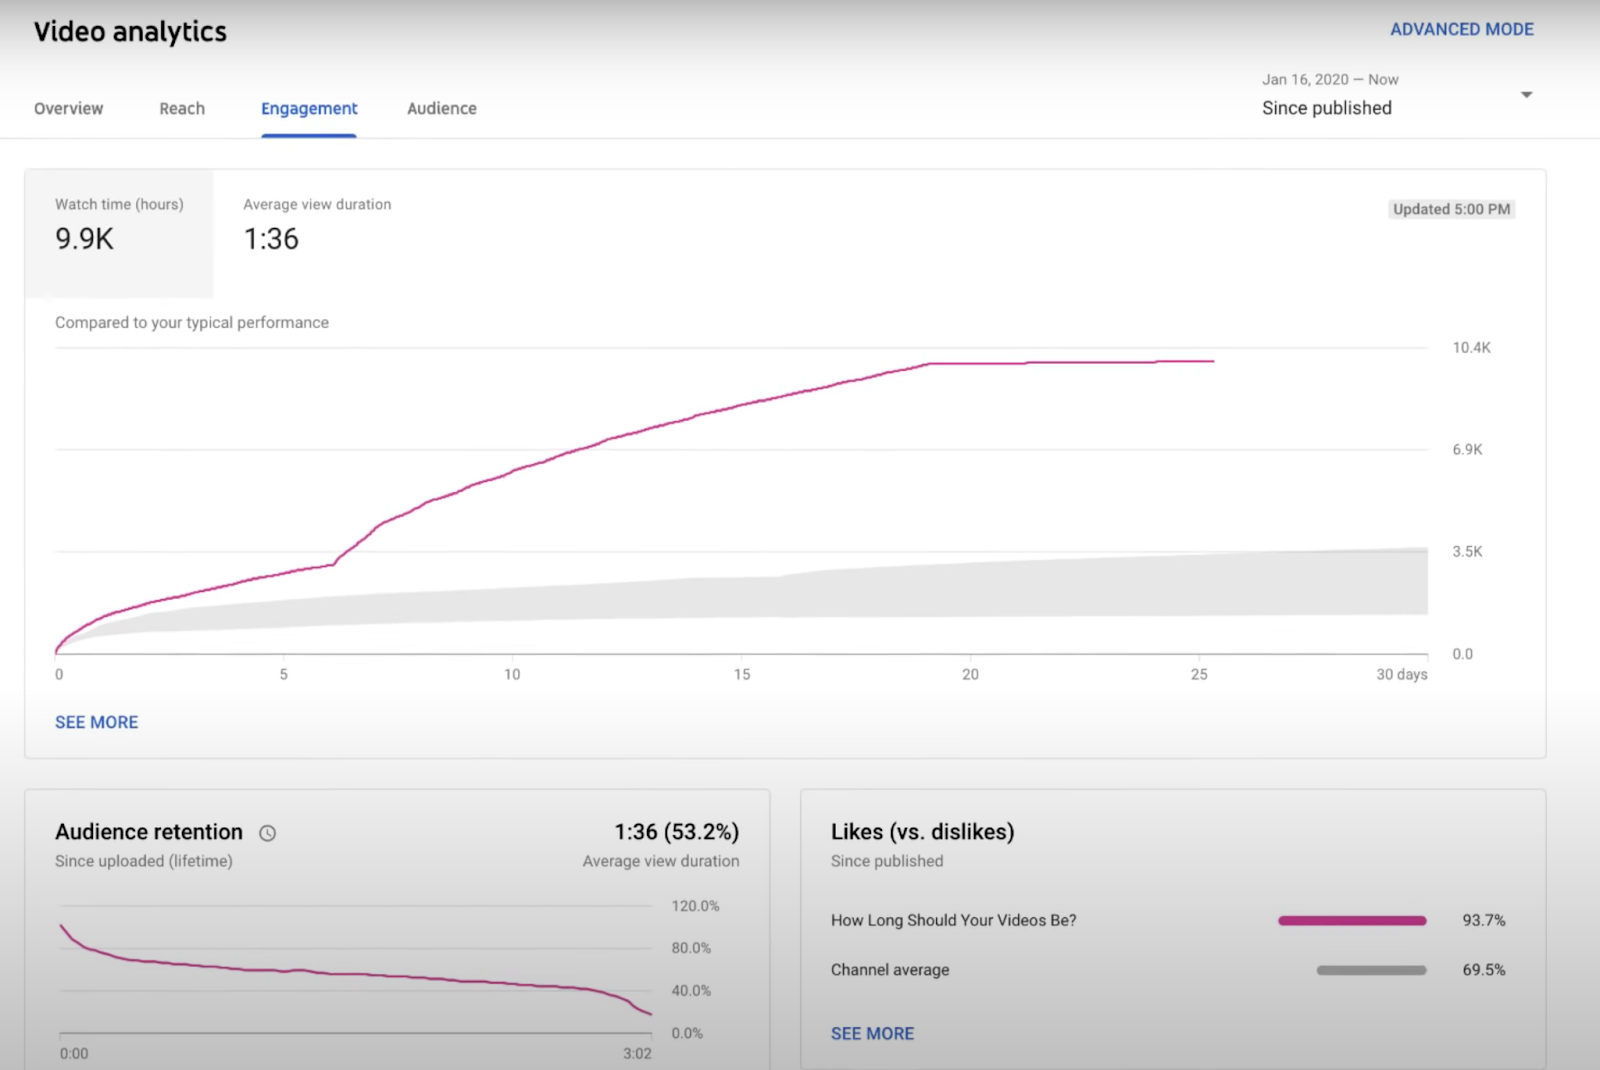
The engagement tab shows how your audience engages with your content. Here are the critical metrics for audience engagement:
- Likes/Dislikes;
- Shares;
- Comments;
- Subscriptions.
Likes and dislikes provide you with immediate feedback on your YouTube video. When assessing likes and dislikes, consider the ratio. If 90% of people pressed the “like” button and 10% didn’t, you are doing quite well.
A video with a lot of dislikes could have problems. When you encounter such content, ask yourself:
- Is the video content relevant to my target prospects?
- Did viewers find my video content offensive?
- Do the thumbnail and title match with the video content?
- Does my video have picture quality and sound issues? To prevent such issues, create a video on a professional video-making platform.
The number of shares is also an important engagement metric—the more people who share your content, the better. If no one is sharing your videos, you need to find the problem.
Next, you have comments.
Comments are a great way to build and maintain audience engagement. You should respond to comments within reason.
Impressions and Impressions Click-through Rates
An impression is when your video thumbnail appears in the viewers’ browser. The more impressions, the more people saw your video thumbnail. Impressions occur when people search for a term, and your video appears in the search results when people click on your channel page and more.
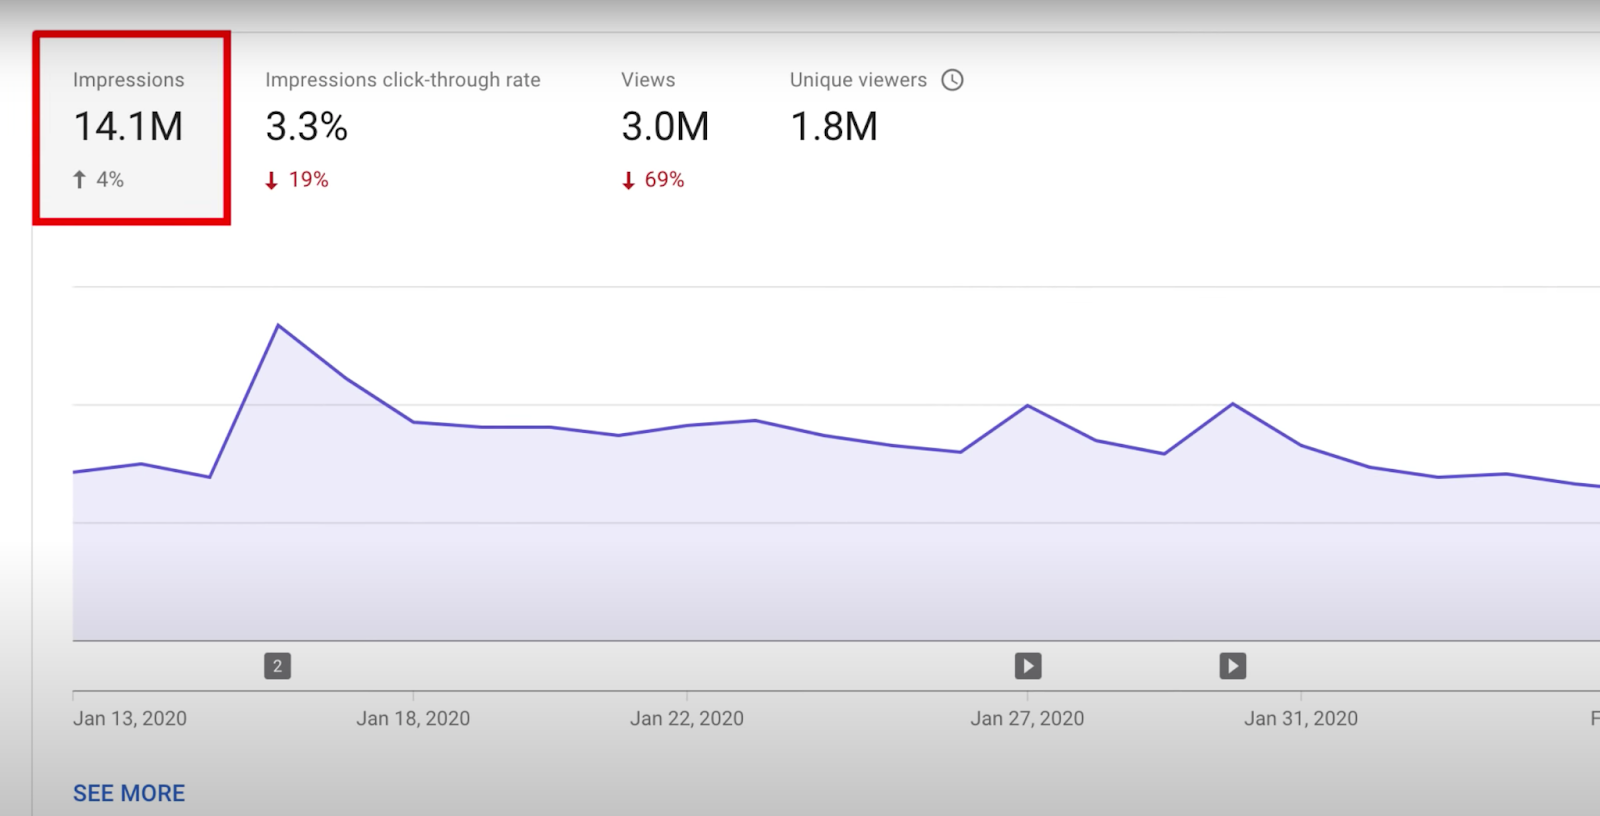
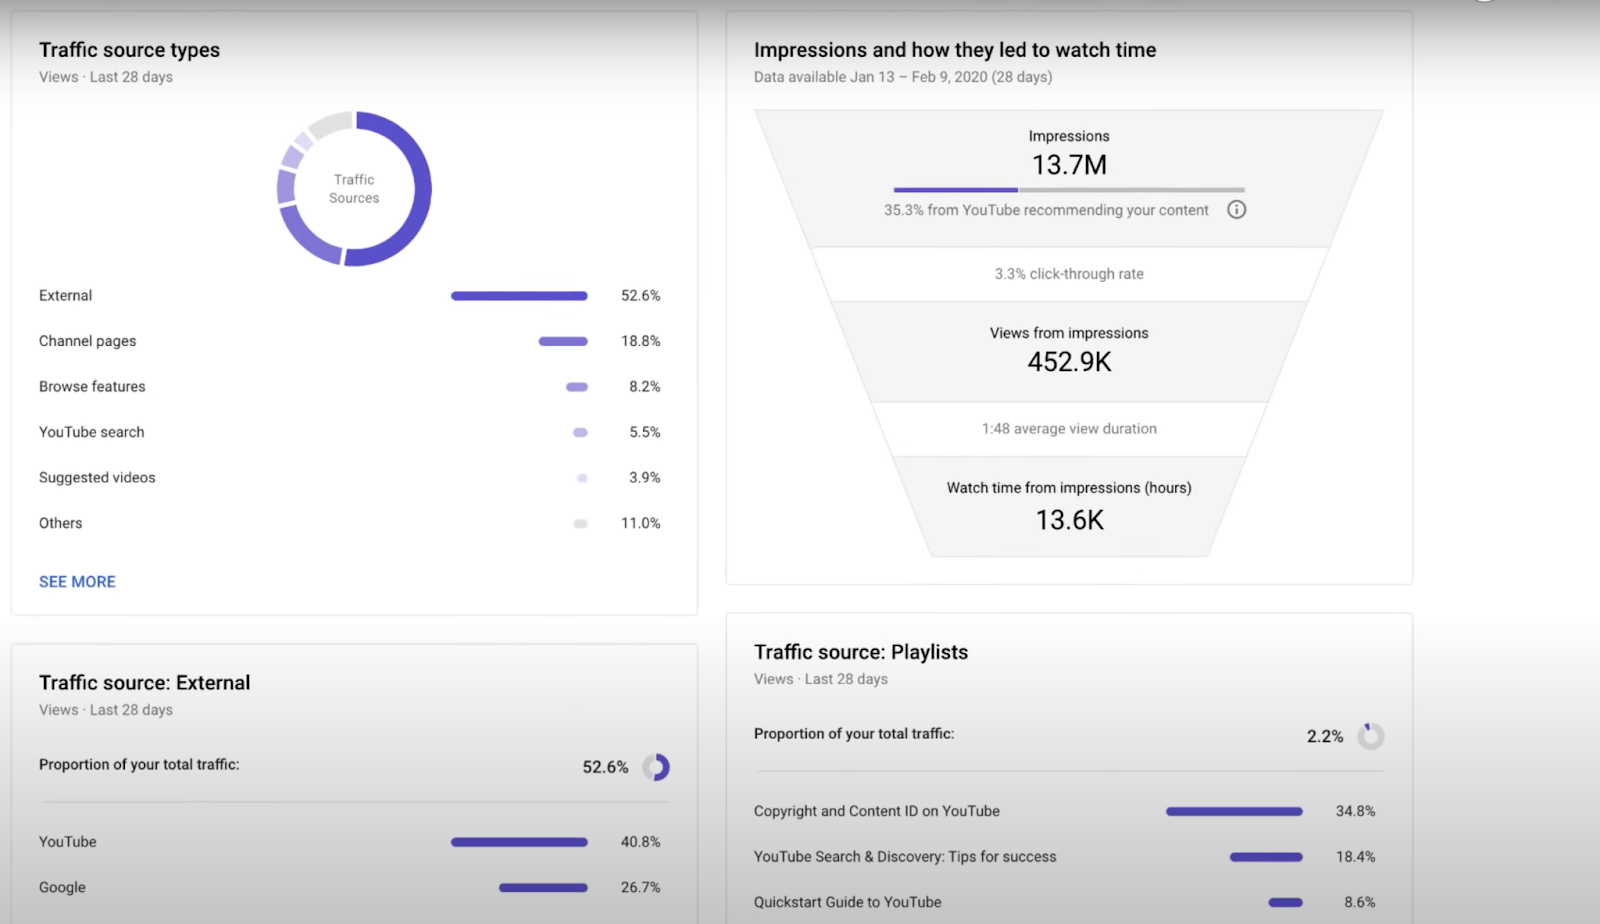
The impression Click Through Rate (CTR) tells you the conversion percentage from impressions to views, i.e., the total number of people who clicked on your video after viewing your thumbnail. YouTube analytics convert impressions and impression CTRs to conversion funnels for more detailed evaluation.
When you analyze the metrics in the funnel, you get an accurate overall assessment of your video’s performance. If you have a high CTR, that’s great.
A high CTR means your video title and thumbnail text generated clicks.

A low CTR means you have a problem with your thumbnail or title. The biggest YouTube stars invest heavily in creating attractive thumbnails and titles that make people want to click on their content. You should do the same thing.
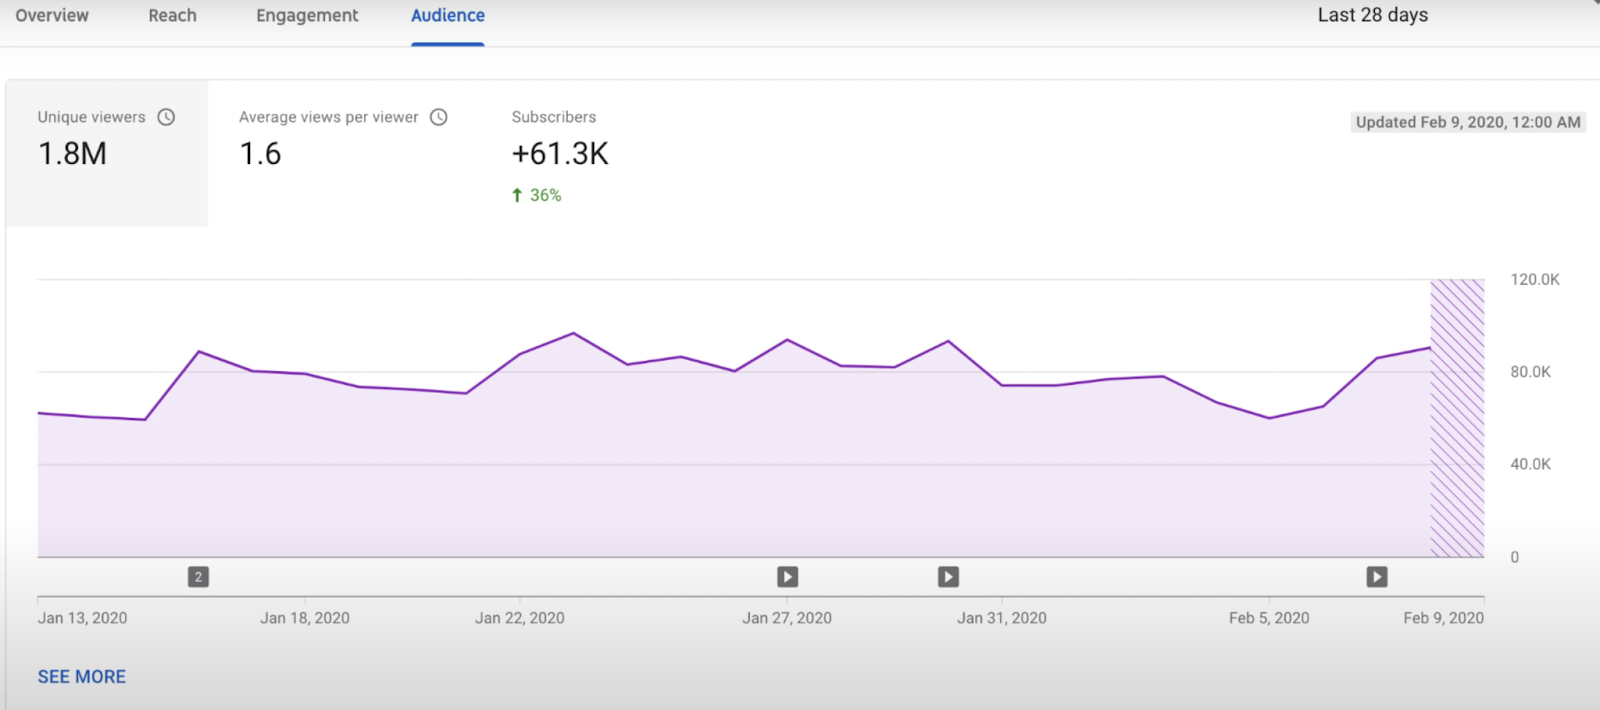
Unique Viewers
The unique viewers metric is the total number of people who watched your content. With YouTube Analytics, you can see the total number of unique viewers.
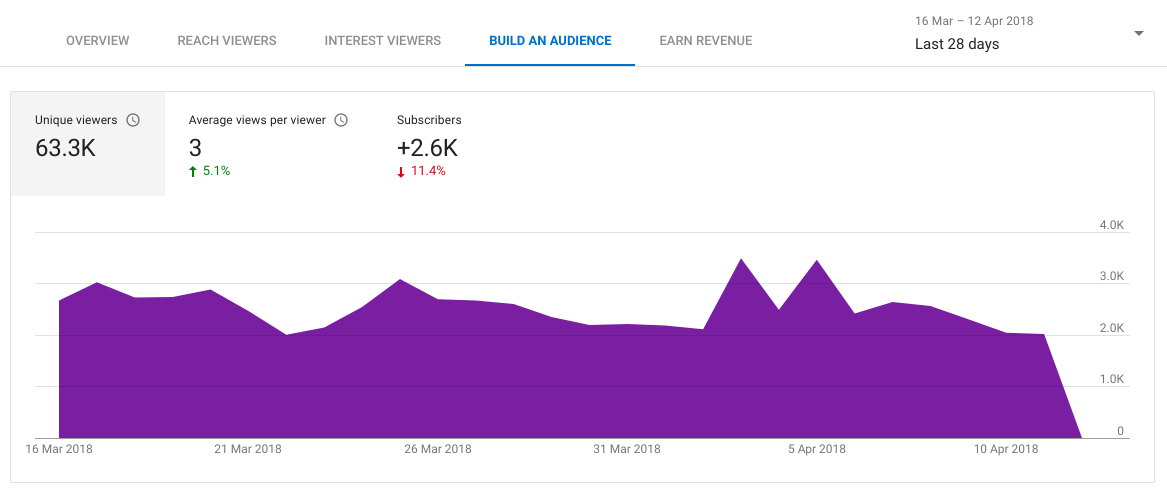
Ideally, you want to have many unique viewers, but those viewers should watch multiple pieces of content. If that happens, it means that people found your content engaging. You should also analyze the number of unique viewers alongside YouTube Analytics metrics like subscriber growth.
Demographics
YouTube demographics isn’t just one metric. On the contrary, it is a collection of metrics that gives you a cross-section of your audience. You may access it by going to the Audience tab and scrolling down:
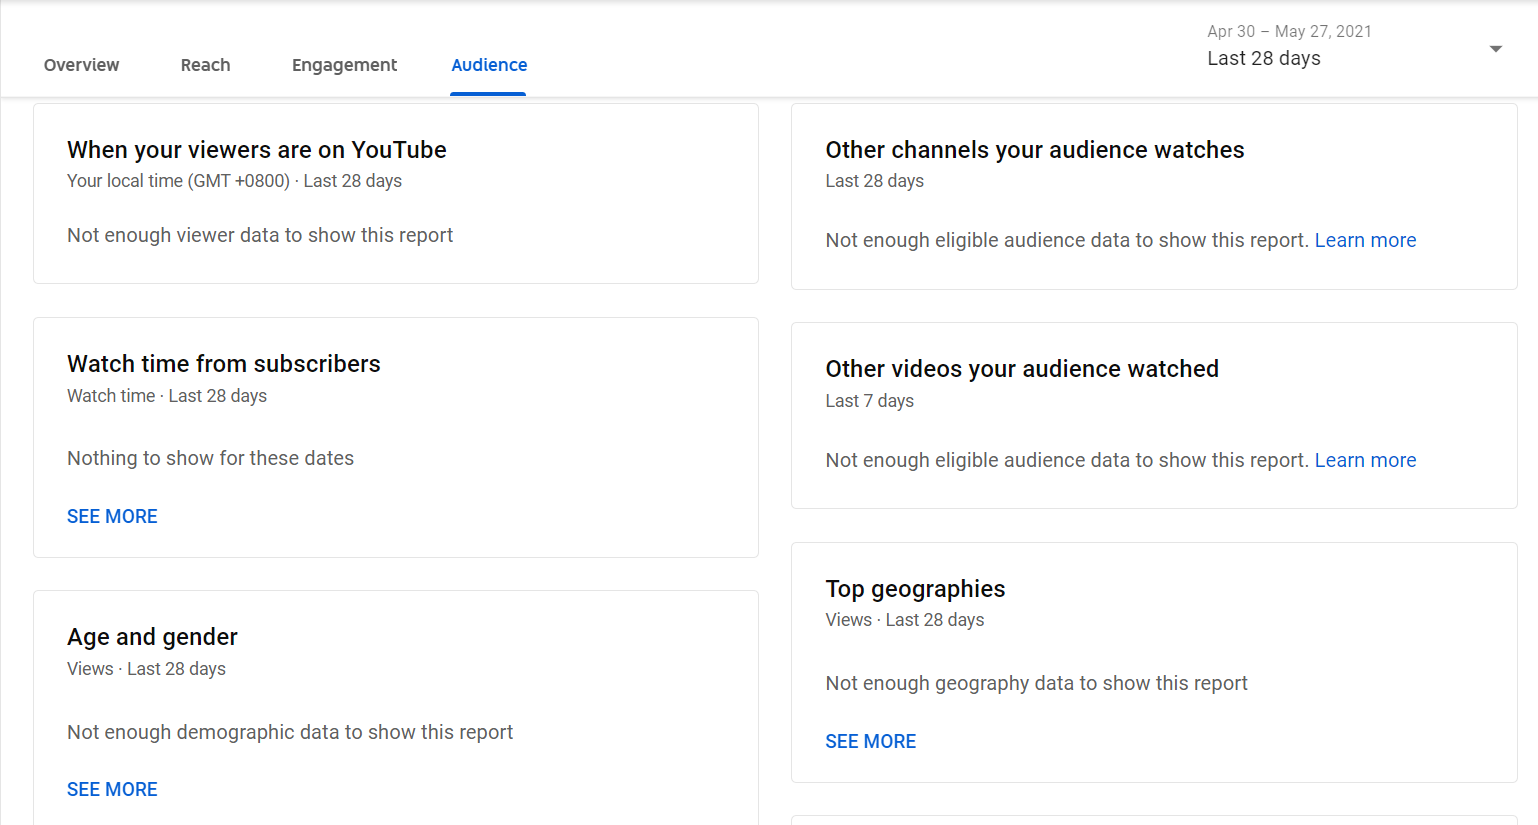
This set of metrics allows you to discover the kind of audience that consumes your content. It also helps you see who is more likely to watch your videos and the ways your audience discovers your channel.
For example, the “age and gender” report will let you see the age range of the people who watch your content, along with their gender and watch time:
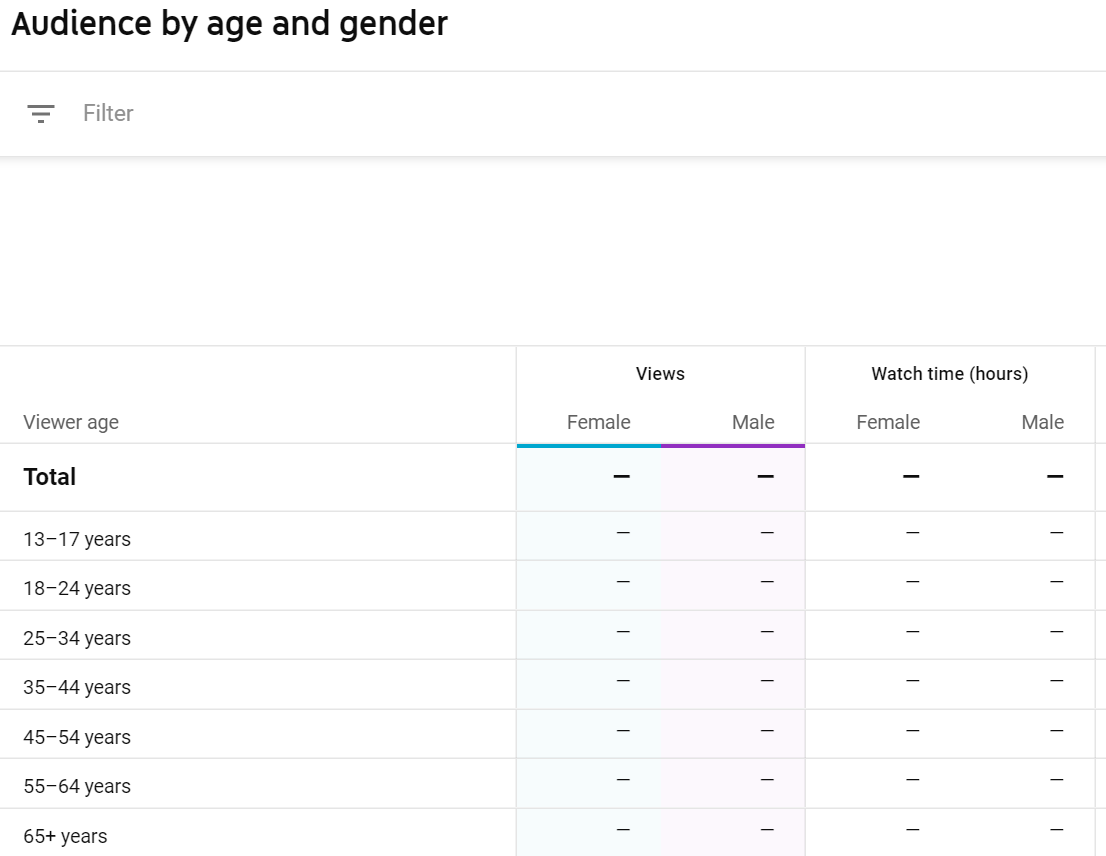
Through the insights that you gain from YouTube’s demographic data, you can create Youtube video that is better aligned with your target audience’s interests and needs. If you’re looking to attract a younger audience but your demographic data shows that you have work to do in this aspect, you could try creating different kinds of content that is more likely to be watched by people in younger age groups.
You may also use this data to determine the demographics of the audience who will see your paid and organic ads. However, you cannot do this within YouTube itself. Instead, you need to go to Google Ads and create a video campaign. You can use demographic data from YouTube Analytics to target your audience:
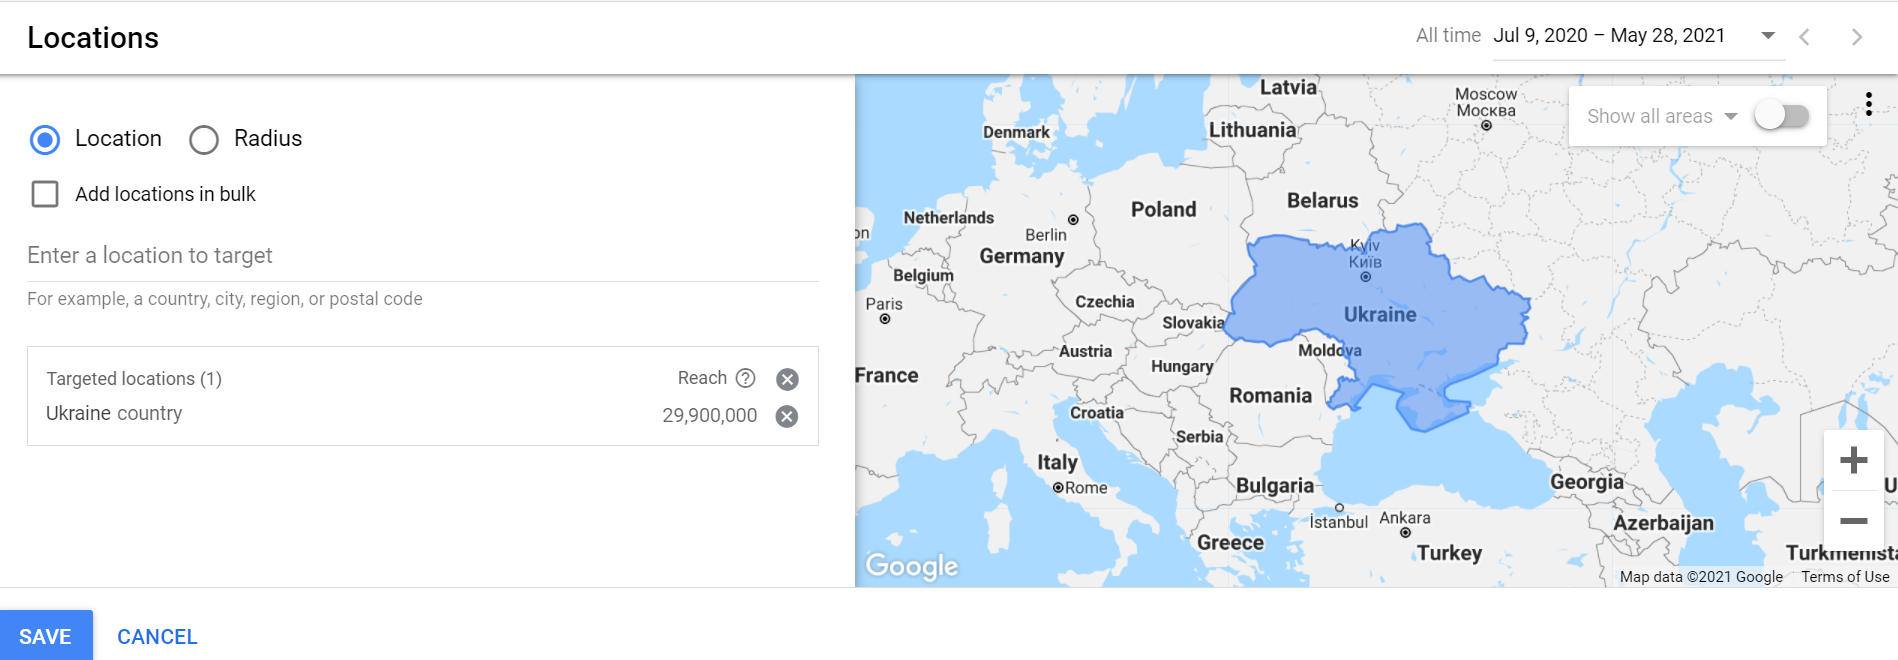
Aside from the location of your audience, you can also use other demographic criteria for your video ads:
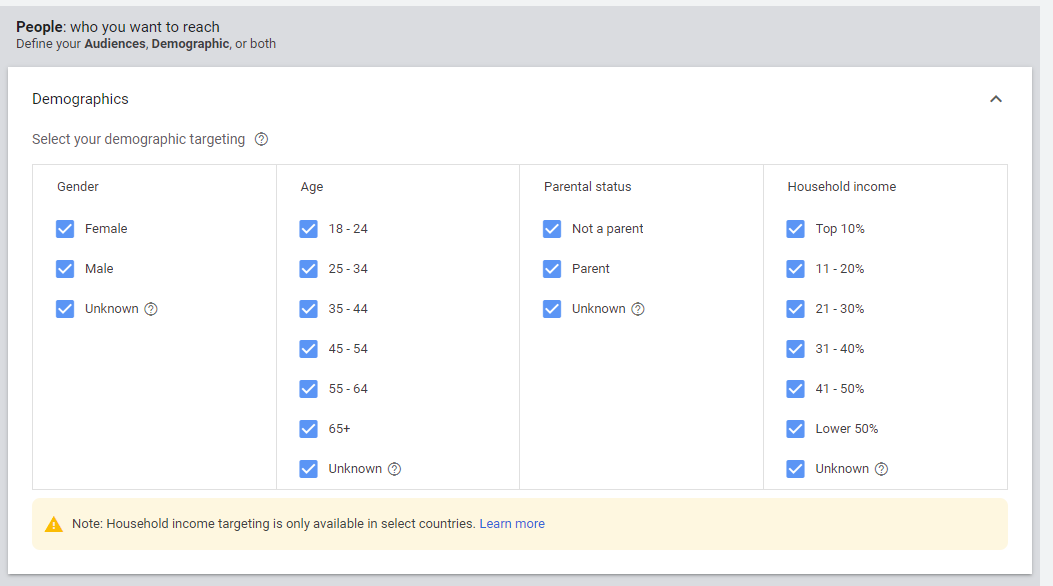
Google Ads lets you target or exclude specific demographics, depending on how you interpret your YouTube Analytics data. You can also define audiences based on their interests and online behavioral history:
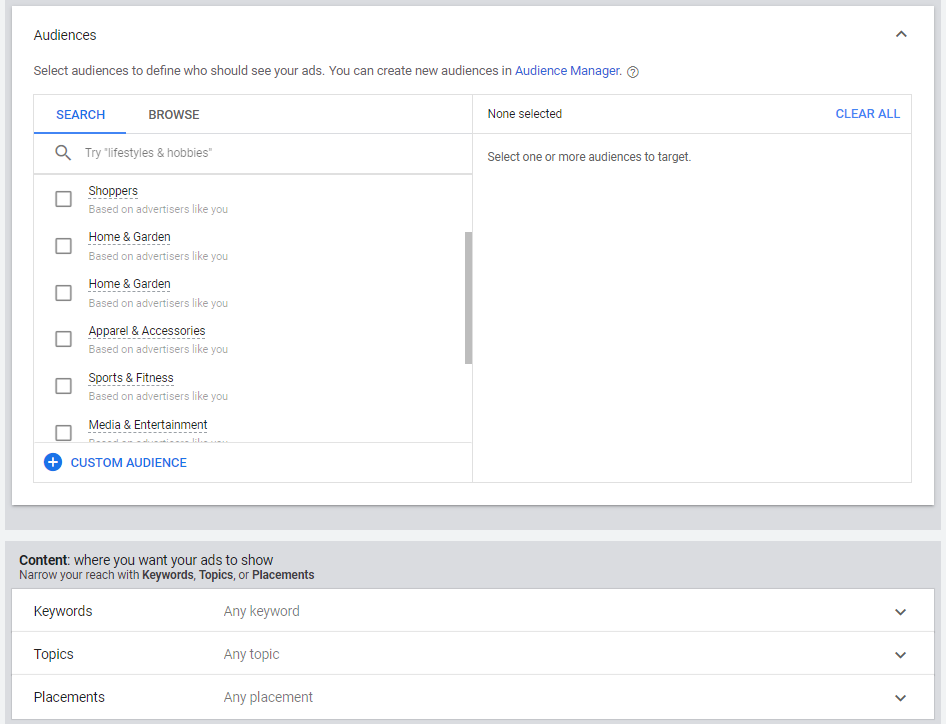
YouTube Analytics allows you to take a long, detailed look at your audience and create more effective video content and ads.
Subscriber Growth
Every YouTubers dream is to have a high subscriber count. Every time you publish a new video your subscribers receive a notification. As your total number of YouTube subscribers grows, so should the organic reach of your content.
Subscriber growth, a key metric, to push video recommendations. Keep an eye on subscriber growth. You should also monitor the correlation between subscriber growth, and the number of people who watch your videos.
Traffic Source
The traffic source metric shows you where your viewers found your content. Traffic sources are grouped into the following categories.
- YouTube searches Traffic using specific keywords and terms to reach your content.
- Channel pages: Traffic acquired on your videos chosen from your main page of the channel.
- Browse pages: Traffic acquired from the YouTube homepage or subscription feed.
- Suggested videos: Traffic acquired from suggestions at the end of videos, additional suggestions, or cards.
- External sources: Traffic you get from websites and social media platforms where your video links have been embedded. Use the most appropriate blogging tools, so your target audience quickly understands what you want to convey.
Your best traffic sources provide a wealth of actionable insights. For example, if you’re getting an increasing volume of traffic from search, you could focus on YouTube SEO.
On the other hand, referrals from other channels indicate an opportunity for effective co-promotion. You could use an email finder to collect the contact details of the channel owner, and inquire about some joint marketing efforts.
Don’t just focus on traffic volume, though. You should assess this factor with other metrics like traffic quality and average view time when analyzing the performance of your videos.
In Closing
With YouTube Analytics, you can track different metrics that estimate your videos’ reach and audience engagement.
Here are the key YouTube analytics metrics that you should track:
- Watch time: This indicates the amount of time people spend watching your videos. If you have a long watch time, it could mean that your videos are engaging.
- Audience retention: This metric measures the number of people who are still watching at certain times during the video. It tells you how good your content is in keeping your audience engaged.
- Engagement: This metric includes the number and ratio of likes and dislikes, shares, and comments. It is a pretty good indicator of audience sentiment towards your content.
- Impressions and Impressions Click-Through Rates: Impressions tell you how many times your video thumbnail appears in your viewers’ YouTube app or browser, while impressions CTR measures how effectively your thumbnail convinces users to click and watch your video.
- Unique viewers: This metric tells you how many individuals have viewed your video. It excludes repeat views and counts only first-time views.
- Demographics: This consists of different kinds of audience data, such as age, gender, and location. It gives you a good idea about your existing audience and whether your videos are actually being watched by your target segments.
- Subscriber growth: If a user is interested enough in your content, they will subscribe to your channel to get alerts whenever you post new videos. Subscriber growth is a great way to measure your audience’s interest in your content and lets you determine whether or not they enjoy it.
- Traffic source: This lets you see where your views are coming from: YouTube searches, the YouTube home page or suggested videos, external sources such as social media or blogs, and channel pages.