

A client is often indifferent to the internal part of the ad campaign — number of displays, clicks, CTR. While asking to launch an advertisement he expects you to answer on more profound questions. Whether advertisements bring calls? Did the ad campaign worth it? Read below how to answer these questions based on data on calls.
In this article, we will discuss the work with clients who have phone calls as part of their requests. Our experience shows that it is at least six business niches. For example, real estate, medicine, legal services, etc. For such clients receiving calls from the target audience is highly important. As they start their cooperation with customers exactly from calls.
We will show below several ways to prove to the client that his company really receives requests from potential customers. All described solutions imply an installed call tracking on the client’s website. Without its help, it is impossible to receive detailed information on the source of calls.
“One of our clients doubted the appropriateness of calling tracking installation. However, Ringostat provides 14 days free trial — and we demonstrated to him that it worth it. As it turned out, the advertisement that we launched brought the most calls. We have already understood how to optimize it and bring the client even more calls. All in all, he agreed to the call tracking installation.
The project was integrated with Google Analytics, and Ringostat tech support configured events display for us. Then we set goals, conversions and integrated with Google Ads. Data were visualized in Google Sheets and Google Data Studio. After that, we showed reports to the client. Thus, he saw the number of calls and how many of them are targeted, as well as the most effective channels”.
Iryna Zozulia,
Head of PPC Department, Alcora Group
The useful article under the topic — “5 reasons to use call tracking for an agency or freelance PPC Specialists”.
1. Call tracking reports
If a client is interested exactly in calls it easier to show him call tracking reports. Considering the most revealing ones among them on the Ringostat example. You can give client access to the project. Thus, he will be able to see all interested data anytime. There is no need to have deep knowledge in marketing or web analytics to understand the effectiveness of advertisements that bring calls based on our reports.
“Ringostat has an intuitive interface that’s why clients on their own open it from time to time. It is comfy for them to see the number of missed calls there, the statistic on sales reps as well as listen to how they work with requests”.
Vadym Slavinskyi,
Head of Paid Traffic Department, Target Media Group Ukraine
Call log
All the consolidated data on inbound calls are brought here together in chronological order. From the advertisement point of view, the most informative columns are:
- source;
- channel;
- campaign;
- the keyword that led to the call.
Ringostat call log contains 6 reports that are available by default. There is a separate report on contextual advertising among them. It’s the fastest way to show the client requests that were driven by launched ad campaigns. Here he can also listen to the recording of each conversation placed in the last column on the screenshot:

A client can see as well how sales reps work with calls — in the Status column. While pointing with the mouse cursor to the icon appears a hint on how the call was processed. For example, no answer, busy, no extension.
Analytics section
Unlike the previous section, the focus here is not on separate requests. It is on data that show how traffic is converted into calls. This section includes ready-made reports that are described in the article.
Here you can show a client not only the number of requests but also proof of traffic quality in terms of calls. For example, via the report on the efficiency of advertising campaigns:
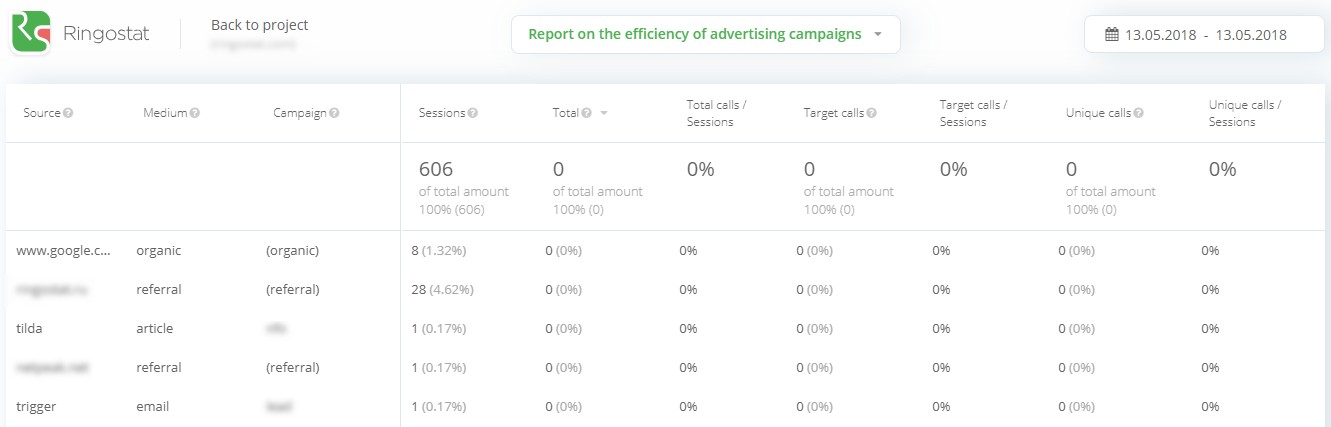
You can see how many calls were brought by specific channels, how many of them are unique, proper. The proper call is a conversation that lasted longer than the set time. Such requests are more likely to be made exactly from the targeted audience.
Custom reports on specific campaigns
Users can easily customize reports in the Ringostat interface including reports on separate ad campaigns. Let’s say, you need to show calls that were brought only from a specific channel. You can create a single custom report and save it. Request our tech support to do so.
Then the custom report will be displayed in your list of available reports. It will be enough to choose it in the required list of the call log. Default reports are already presented there.
Callback report
If a client has Ringostat callback installed on his website he receives a part of requests via this form. That’s why it is important here to understand how works advertisement and whether it brings calls via callback.
There is a special statistics for this case Statistics — Callback statistics.

For sure, the great amount of calls doesn’t ensure the success of the campaign. At least you need to listen to recordings of conversations. Thus, you will understand that the ones who are calling your clients are exactly potential customers.
How to make it fast and effective, read in the article: “PPC Specialist should listen to recordings of calls from advertisements. Why?”
2. End-to-end analytics
What can be a better proof for an agency work than the revenue that was brought by advertisement? You need end-to-end analytics to receive ROI on each separate channel. Its reports would show the importance of your job better than metrics unknown for the client, such as CTR, CPC, etc.
However, companies unwillingly install new services. As they require additional investments, PRD agreement, their support, etc. That’s why it is more convenient when one platform includes both end-to-end analytics and call tracking as for example, Ringostat. To receive these data you simply need to have an account in the service, configure integration with CRM and advertising accounts using manuals. As a result, you will be able to provide the client with reports that have the most important metrics for him — costs, revenue, and ROI. It is also possible to manually upload costs and not to be limited by integrated systems. Thus, you can evaluate the efficacy of investments made in SEO promotion or, for example, banner advertisement.

Example of Ringostat end-to-end analytics report
3. Google Sheets
You can also show reports to a client in Google Analytics. The call tracking is integrated with this system and transfers data on calls. However, we won’t discuss this method in this article as it is evident. Moreover, we can’t say that the Google Analytics interface is absolutely clear to a layman. That’s why a lot of specialists provide more comprehensible reports to their clients presented in Google Sheets.
“We systematically use automatic reports that Google Sheets drive from Google Analytics. And we see the picture in general. Not only conversions but the whole advertising campaign progress considering requests made by phone. It is especially useful that due to the integration with Ringostat data on missed and proper calls are displayed there. Such reports are made once in two weeks”.
Vadym Slavinskyi,
Head of Paid Traffic Department, Target Media Group Ukraine
Read below the easiest way to set up reports in Google Sheets.
- Configure a call tracking integration with Google Analytics, if you haven’t done it yet. Ringostat clients’ data are automatically transferred to this analytical system. It is only needed to set goals.
- Set the data transfer to Google Sheets. The easiest way to do it is by using Google Analytics extension.
- Decide what data you want to see in the report and customize it. You can make the report update on a regular basis. Or set the period for the update:

- Make a visualization:
- graphs and charts that show the dynamics of growth of requests brought from the advertisement;
- contrasting background and column colors;
- diagrams creation by clicking on the checkbox.
You can see below how data from Google Analytics are visualized in Google Sheets. This report doesn’t contain data on calls, however, they can be simply included during the report customization.
4. Google Data Studio
The main advantage of this tool is in clear interface and built-in connectors with Google Ads and Google Analytics. Our client Steko, a manufacturer of plastic windows, works with it. The company analyzes data on calls that they receive using Ringostat and reports that provide the Netpeak agency. Consolidated reports are formed based on this data and then visualized in Google Data Studio.
We also had two interesting cases from the Promodo agency. They built analytics for a dental clinic and a company that provides plastic windows installation. Meanwhile, they didn’t use CRM and end-to-end analytics systems.
Sales reps put data on calls in Google Sheets. Moreover, they put a status there — “thinks”, “expensive”, “record on a measurement”, and a type of the service. Specialists transferred data from Google Analytics and Google Sheets in a single dashboard. After what they combined all this data by a phone number and visualized in Google Data Studio.

Using filters in Google Data Studio you can customize graphs by types of campaigns, devices, days of the week, traffic channels. For example, budget, conversions/calls, and CPL (cost per lead).
5. Microsoft Power BI
Specialists prefer Power BI due to its multifunctionality, flexible settings, and integrations. It allows connection to hundreds of data sources even having a free tariff. Using it you can also demonstrate the effectiveness of advertisement considering calls.
Тhus, Power BI is used by our partners — Convert digital marketing agency. The agency creates and customizes ad campaigns and landings, as well as tests them, for the multisectoral hospital. The client uses ERP and a call tracking, as 80% of requests to the hospital are made by phone.

Example of a hospital report in Power BI
The agency builds marketing reports to monitor the KPI achievement in Power BI. To do so is used the integration of Ringostat with BI-platform and Renta service. It drives data from Google Analytics to the database. Information from other ad accounts such as AdWords, Facebook, etc, is also transferred there.
How builds this process:
- data extraction from Google Ads to Google BigQuery via Renta connector;
- data extraction from Google Analytics to Google BigQuery also via Renta;
- report creation in Power BI based on received and consolidated data.
Conclusions
- If calls are the part of the company’s requests the effectiveness of the advertisement can be prooved via call tracking. The client himself or with your help can see the following in its interface: the number of calls, advertising channels that brought them, how many of them were proper.
- End-to-end analytics usage is the best way to prove the efficacy of launched ad campaigns. Its reports would show the importance of your job better than metrics unknown for the client, such as CTR, CPC, etc. But the most important thing here is that end-to-end analytics shows ROI which is the most important metric for your client.
- Another way is to transfer data to Google Sheets. Using manuals, you can configure data that will be transferred to the dashboard, as well as it will be updated. You can also easily adjust the color scheme, charts and many more in Google Sheets.
- Data on advertising efficacy can be visualized via special tools — Google Data Studio and Microsoft Power BI. Creating reports in these programs requires some skills, however, as a result, the client will receive a clear and colorful dashboard.