

The main goal of an advertisement is the profit but not conversions, calls or requests. You are probably losing money if you are still looking for interim targets. However, Ringostat clients won’t face this problem anymore as the end-to-end analytics has appeared on our platform. Find out your advertising budget and profit in one window without complicated calculations and switching between different systems.
First of all, let’s notice: it’s not “one more end-to-end analytics” but a new generation tool. The Event-Driven attribution, time decay, and customization is all the professional marketer needs to make considered decisions. This distinguishes our end-to-end analytics from other services that provide functionality with the same title.
Why do you need end-to-end analytics
Incomplete data are often available to business:
- in advertising systems, as well as systems of analytics — only data on online conversions that might even not lead to sales;
- in a call tracking — data on calls and advertising sources that brought them;
- in CRM — information on purchases and profit.
None of these systems don’t show the whole picture: starting from investments in the advertisement, ending with the profit gained from it. Business doesn’t know the cost recovery of different ad campaigns. That’s why some part of the budget is lost as it is invested in something that doesn’t work.
End-to-end analytics is not about CTR, CPC and other rates that are far from business. It is about money and sales — the most measurable and valuable company resource. That’s why end-to-end analytics is useful not only for marketers but first of all for founders and top managers.
What gives you end-to-end analytics
- Discover the cost recovery of your investments in every advertising channel. End-to-end analytics provides an understanding of ad campaigns ROI up to the keyword.
- The maximum flexibility of settings for every business needs. This distinguishes Ringostat end-to-end analytics from other services that provide the same-titled functionality. Forget about default settings that don’t take into consideration your company’s peculiarities. Customize any attribution model, time decay and weight for different purposes.
- Work in one window. No need to create reports and consolidate data from different systems on your own – Ringostat end-to-end analytics will do it for you. Receive key indicators via ready-made reports.
You know how much you spend on ads. Ringostat helps you to find out how much revenue brought you each advertising channel. To do so, you don’t need to consolidate data, create reports or make complex calculations. The end-to-end analytics will collect and calculate all the data for you. You can also manually upload data on costs right in end-to-end analytics. Thus, you can evaluate the cost recovery of investments, for example, in SEO promotion or banner advertisements. Read more in the article.
However, it’s just the “front” of Ringostat end-to-end analytics opportunities. It can be customized based on your business processes and in strict accordance with the sales funnel. Meanwhile, data will be as accurate as possible due to the functionality that distributes the conversion value to each channel, according to specific factors. Read below on the distinguishes from other same-titled services.
How Ringostat end-to-end analytics works
NB Report on end-to-end analytics works only with installed integrations — how to connect them is described in Ringostat knowledge base.
All data that we will discuss below are available in the “End-to-end” analytics report in the Analytics section of Ringostat account.
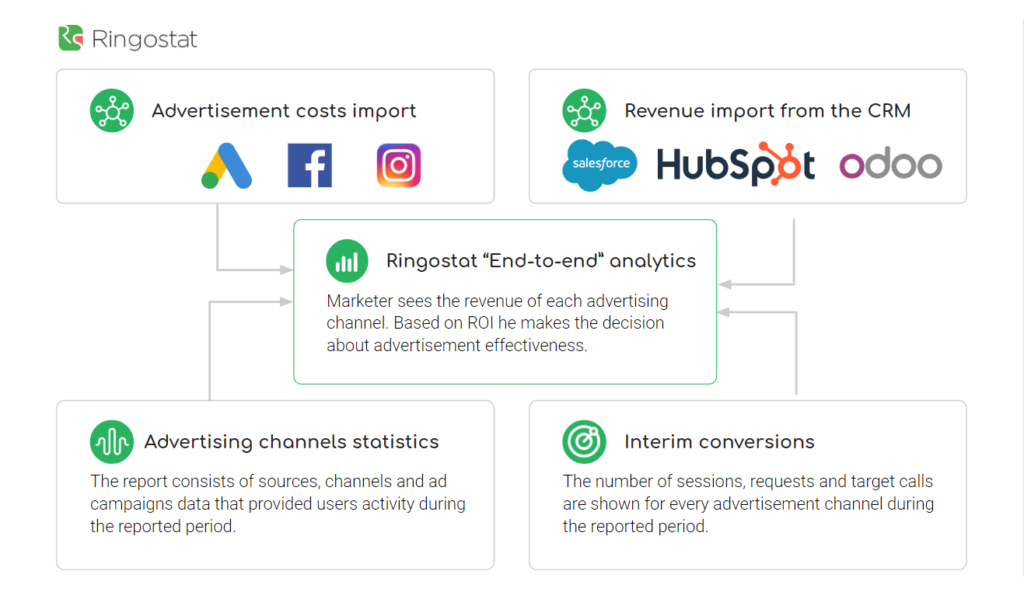
1. Cost of advertising import
Due to the integration with Google Ads, and Facebook/Instagram cost of advertising from these systems is transferred to Ringostat. Classified by different campaigns data are shown in the “Cost” column.
2. Revenue import from CRM
The information on revenue from every ad channel is available in Ringostat under the condition of the integration with CRM. This list will be extended in the future. The information is shown in the “Revenue” column. The number of closed deals is also displayed by every channel.
3. Statistics on ad campaigns
Data on every advertising activity are transferred to special columns:
- number of sessions;
- calls;
- targeted calls.
4. Advertisements cost recovery
The most important column is the ROI — a metric that shows the contribution to profit attributable to marketing. It indicates the work of every channel and the revenue that it brought. Based on ROI, client judges on the effectiveness of different advertisements:

Example of the end-to-end analytics report
NB Due to the formula that uses Ringostat if ROI > 0, it is considered as successful.
And it’s not all. Ringostat end-to-end analytics provides the most objective assessment of marketing effectiveness due to Event-Driven attribution, time decay, and customization.
Advantages and key features of Ringostat end-to-end analytics
You can find settings that we will describe below in the Integration section of the needed CRM.
Event-Driven attribution
Attribution is the rule that transfers the conversion value to different points of contact with the brand. Based on the attribution the analytics system defines the value that will be divided between specific channels.
There are different models for this rule in the analytical systems. However, they don’t take into account the business particularities. Ringostat, for its part, has flexible settings to solve this issue. You can assign the value to the specific actions of the user. Consequently, the platform will calculate the contribution of each channel to the conversion.
There is considered the impact of advertising channels on the achievement of every deal stage. The sum is divided between the channels combined with the funnel stage weight after the deal is closed.

What is the funnel stage weight
Weight is the contribution of different channels in the sale. The customer may several times interact with a brand before the purchase. However, these interactions don’t have the same value. Weight is assigned to each funnel stage, depending on its value for the company’s marketing. It can be measured by any scale convenient for the user. E.g. from 0 to 10.
Example
- “Website first visit” stage, weight 8. A user visited the website for the first time and got acquainted with the brand. The company received the client ID and may work with the user via marketing instruments.
- “Website another visit” stage, weight 1. The advertisement made less impact in comparison with the previous stage. It is possible that the user visited the website to specify something.
Customization
Funnel stages setup
End-to-end analytics shows all the funnel stages presented in CRM. Status of all deals came to the same-titled column in Ringostat via API. You can setup status according to such stages: “in progress”, “won” and “lost”. Status can also be easily pulled between columns.

Goals setup
It is possible to set the desired result of a deal for interim goals. For example, you can set the goal “Prepared an offer” for the “In progress” status. Similarly, you can set up the goal “Received documents” or “Scheduled a consult” for “Negotiations”. Due to this, when the client will reach the goal, it will obtain the indicated weight. Even being at the same stage, different goals may be closer to or further away from the sales, and therefore have different weights.

Statuses from the column “In progress” are duplicated to the same-titled column from the “Stage settings” section.
Weight setup
Set value for a visitor’s specific actions on the website. You define it according to your business processes. Thus, the second visit is not that important during a flat purchase so you can assign, for example, weight 5 for it. However, the second visit during a food order may mean one more purchase. That’s why the weight here can be greater, for example, 8.

Example of the weight assigned to different funnel stages
Time decay
It is the period when the value of the interaction is slowly getting declined. Concerning the advertisement, the closer to the conversion the more valuable the channel that brought it. There is the Time decay model in Google Analytics that has a similar working principle.
Time decay indicates the limitation period when a customer made certain actions, in other words, goals. For example, visited the website for the first time, called for the second time, etc. The last point of interaction is considered as the most valuable. Moreover, the value of others decreases as time goes on.
The time decay is counted via a special formula. The value of a separate event is getting less important by the time the deal is getting closed.
Due to the time decay in Ringostat end-to-end analytics, you can set value for goals considering the deal cycle duration. The longer it is, the length has to be the time decay. We recommend you to make it equal to the deal cycle.
Several goals can be completed during one session. For example, a customer may both make a second call and a request. That’s why the weights of some goals add up for one session. Thus, with the time decay, the rate is deducted from the total weight of the session.
Example of Ringostat end-to-end analytics work
A customer passed four funnel stages. On every stage, he visited the website from different sources. According to end-to-end analytics settings, the weight was divided as follows:

However, the data wouldn’t be accurate if Ringostat didn’t consider the limitation period for every action. Read below the example of the formula work that we described above.
Let’s say, the time decay is 15 days. Nevertheless, all conversions from the example above happened 30 days after. This factor influences the result as a number of days that have passed during conversions is also counted in the formula. The far is the contribution of the purchase it receives less weight. In other words, the value gets less in retrospect from the closed deal. As a result, we have the following value:
- cpc — weight 0,4;
- organic — weight 2,3;
- direct — weight 1,3;
- email — weight 1,9.
The amount of the transaction is 1000 USD. Ringostat automatically calculates the proportional contribution of every channel to the deal. It adds up all the weight of stages and divides each of them. For example, the first visit from cpc weight is 0,4 that divides by the total adjusted weight — 5,8. We receive a coefficient of 0,08. To understand the contribution of this channel: 0,08 х 1000 (the amount of the transaction) = 80 USD. The contribution of other channels is calculated similarly.
The advantage of Event-Driven attribution is that it divides the amount of the transaction by every channel, depending on its weight and the limitation period of the conversion. Standard models simply can’t consider such nuances. However, summary data are not enough to invest in advertisements.
The benefit of Ringostat end-to-end analytics is that all these complex calculations are made automatically. In a few seconds, you receive the data that are as accurate as possible. All you need is to make basic settings, regularly check report and make decisions.
Summary: what are the advantages of Ringostat end-to-end analytics
- Full data to understand the effectiveness of advertisements. You are not limited anymore by interim web traffic metrics, calls or online conversions. There are exact numbers — how much was spent on ad campaigns and how much was gained. This information is quite valuable for a CEO and marketer.
- Attribution models flexible settings. Do not use default rules that are not related to your business. Configure the funnel based attribution that displays the stages of a deal exactly for your company. Set the time decay and Ringostat will automatically count the value of a certain channel.
- Save your money and time due to work in one window. Now you don’t need to connect additional services, create dashboards from nothing or switch between different systems. You see the most important data right in Ringostat account.
Text to our chat or comments below and we will give you more information on end-to-end analytics setup for your company. Our tech support is always ready to help you with the integration of new features.