

The advertisement that brings revenue is effective, it seems easy, right? However, in reality, it is impossible to bring together sales and ad campaigns in the analytical system. For sure, if you don’t have an e-commerce module. With its help, you can track how many closed deals were made due to the contextual advertising, the revenue that it brought, the average check size, and many more. But lots of website owners don’t have such a module. This article was written for them. Read below how to check the efficacy of contextual advertising work using specific metrics and reports.
Simply saying, the perfect ad campaign is cheap and brings a lot of profit. That’s why the rating of contextual advertising effectiveness includes two metrics:
- costs per campaign;
- revenue that it brought.
We will set metrics and formulas below that will help you to evaluate the effectiveness of the launched advertisement. However, if you have end-to-end analytics it will count everything for you. Thus, Ringostat has the functionality that automatically counts ROI by each ad campaign, as well as the cost of the proper call. You will be able to see the cost recovery of advertising channels, that is the best way to prove the effectiveness of contextual advertising. If it is required, you can also manually upload costs on campaigns. For example, to check the cost recovery of investments in SEO, banner advertisement, etc. There is no need to know special terms or to count something.
However, in this article, we will discuss other ways to analyze the ad campaign success. In this case, the real sales are not counted in the system. Thus, the effectiveness of advertisements is defined by interim metrics. It means that you won’t receive the same accurate data as if you were using e-commerce reports. The good thing here is that you will receive a general perception of ad campaigns work. Let’s review basic terms that will be useful during the work with analytical systems.
Contextual advertising efficacy: basic terms
CTR
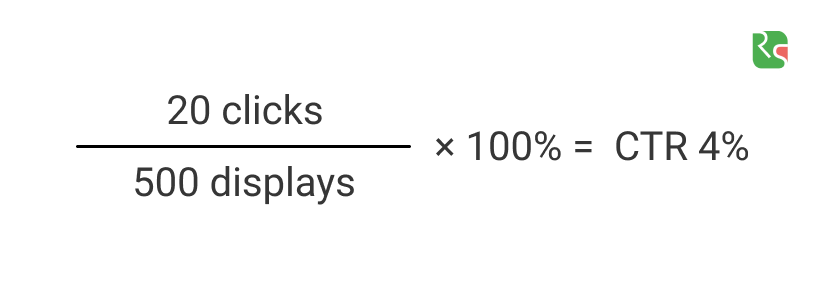
Click-through rate (CTR) is the ratio of users who click on a specific link to the number of total users who view a page, email, or advertisement. The disadvantage is that the opened website doesn’t always equal to purchase. It may be even a child who randomly clicks on the parents’ smartphone. However, CTR gives an additional understanding of the advertisement attractiveness to potential customers. How to count:
CAC: Customer Acquisition Cost
Without this metric, ad campaigns may seem more successful than they really are. If there are a lot of sales, however, you have spent even more on the promotion, there’s nothing to be happy about. We will set an approximate calculation. The average metrics are used to show the counting logic.
Let’s say your advertising budget for paid ads was 115$. The advertisement brought 300 visitors to the website. CPC is 0,38$. Suppose among 300 visitors there were 15 that filled in the callback form. 115 divide in 15 and receive 7,6$. That’s the CPL (cost per lead) metric. Meanwhile, among 15 leads only 5 made a purchase. It means that the CAC is 22,8$.
Both these metrics CAC and CPL have to be considered separately. If a few numbers of leads become real customers, it is a reason to make an additional verification of the sales department work. It is possible that sales reps miss calls, however, the cost per each lead is rather big. You need to rely on CAC during the calculations of the cost-effectiveness of sales via paid ads.
Conversion
If you want to understand how many people are simply browsing the website and how many of them are interested in the product or service, you need to focus on conversions. Conversion is a rate of people who made a proper action with the general number of visitors.
Example of the calculation:
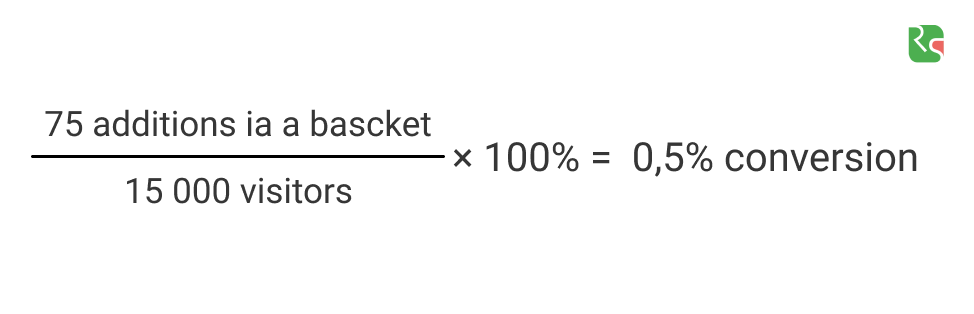
The conversion rate explains not only the traffic quality that was brought by advertisement. However, it also gives an understanding of whether the platform makes a customer want to make an order. To decrease the CAC and increase the revenue from advertisements you need to seek the increase of conversion rate.
Goal
It is not enough to know how many visitors were brought by your advertisement. Sales are important but not visits. Thus, you need to track website visitors’ actions that seem like potential customer’s conduct. In the analytical system settings, you may set the following rule: every time a customer makes a specific action on the website, the system counts it as achieving the goal.
Before checking, make sure that goals in the analytical system are set correctly and the most important actions of customers are tracking. Otherwise, you’ll have to count the effectiveness of advertisements by the number of clicks which is not a reliable metric. Goals have to be the more close possible to the revenue achieving for the company. For example, the event “Contacts page overview” will give you less information on the effectiveness of advertisement than “Add a product to the basket” or “Feedback of purchase page visit”.
Goals may differ depending on the website’s specifics. Here are several examples:
- making a request;
- alert subscription;
- callback form filling in;
- price downloading, etc.
Goals that analyze visitors’ behavior may also be set. For example, the duration of the session is more than 3 minutes. Or so-called page depth, in other words, the number of viewed pages per session. However, these are only proxy indicators of advertising effectiveness.
You can see below an example of Google Analytics Conversions — Goals section where you can see the full list. We took this analytical system as an example as it is the most popular in the world.

There is one thing that can make a great effect on data accuracy. Google Analytics considers only the visitors’ online behavior. However, in most of the niches, customers call before the purchase. You can’t put in a basket in one click a house or medical service. In this case, the purchase is processed offline and can’t be fixed by analytical systems.
Call tracking is created to fill in this gap. Such services collect detailed statistics on calls including ad sources that drive to phone requests. Information is automatically transferred to analytical systems. Thus, one more goal appears in reports — call. Read more in this article on the call tracking work.
How to compare data correctly
You need to wait sometime before the data will be collected before checking the effectiveness of contextual advertising. However, you need to consult reports once a week even if a website has low traffic, up to 100 visits per day. For example, a few days after launching an ad campaign it is better to make sure that the number of transfers increased. Use data per month to receive more global conclusions.
If you have changed the campaign and want to check how these changes affect productivity, you need to write down the baseline to have something to compare with:
- amount of traffic;
- CTR and CPC (cost per click on an advertisement) — these metrics have to be analyzed together to understand the customer acquisition cost;
- cost of proper conversion;
- number of reached goals;
- conversion.
A week has to be compared with week, a moth with a month. Do not compare periods that include holidays and weekends with workdays. You need also to consider that a week starts on Sunday via Google Analytics.
Basic reports
Among the key rates described above, there are also metrics that indirectly show the effectiveness of an advertisement. Although, we don’t recommend to go deep in them. They do not always show the real picture. Let’s say that specific of your product requires a long-term choice. That’s why a website visitors that open it from smartphones prefer to return via laptop. If you are oriented on a refusal metric, you may wrongly think that the advertisement doesn’t work. As part of visitors immediately left the website.
We are talking about the following metrics.
- Refusal. When a user opened a page, however, he didn’t interact and close it.
- The average duration of the session — how much time a visitor has spent on the website. This is the indicator for blogs: whether a visitor read the article or simply opened and closed it.
- The average page depth — how many website pages a user visited per session.
We have already told above that it is important to set goals. By doing so you will see actual metrics on them. Thus, you need to choose the appropriate goal in the Conversions block.

Reports on ad campaigns
You can find them in the following sections: Acquisition — Campaigns — All campaigns and Acquisition — Google Ads — Campaigns. In the first case, the report includes all traffic sources, for example, transfers from organic and email. Google Ads section contains 12 detailed reports only on ad campaigns on Google. The most informative one is called Campaigns. It shows user activity on Google Ads advertisements and investments in it:

A similar sample is displayed for all keywords in the same-titled tab.
In the Treemap report, you can see the visualization of different metrics for all campaigns. You can rely on several metrics, for example, “Refusal rate” or on “Pages/Session” as in the example below. On the screenshot below, square with users that visited fewer pages is pink. The bigger the square is the higher the number of pages that viewed visitors brought by this ad campaign.

Report on keywords
Analyze keywords that drive traffic not only by Google Ads campaigns. Go to Acquisition — All Traffic — Source/Medium. This report is valuable as it gives an understanding of all sources that bring users on a website. For example, you invested a lot in Bing paid ads, however, it takes the 10th place by the number of driven traffic. It means that this campaign may be ineffective.
Let’s get back to the analysis of the keywords. It is useful to evaluate the traffic quality as this report shows keywords that brought visitors from every ad campaign. If we are talking about Google paid ads, you can see the data on keywords in the following report: Acquisition — Google Ads — Keywords.
Pay attention to the moments below.
- Keywords that generate the most transfers. If they are not relevant to your website topic, it means that the advertisement simply wastes the budget.
- Keywords that often lead to achieved goals. Click on the column name — Purchase Completed (Goal Completions). Thus, keywords will be displayed in descending order.
Report on multi-channel funnels
Shows customers’ journeys up to the conversion. It’s not that often when a customer opens a website and instantly makes a purchase. In most cases, it doesn’t work like that.
Let’s say that someone “N” wants to buy a hiking backpack so enters this expression to the searcher.
- He sees paid ads above the search results and clicks on it. Thus, he is transferred to the online store website. “N” has found what he needed there, however, he decided to consult his friend before making the purchase.
- The next day, the customer makes a direct transfer to the website by entering the online store name to the search engine. There he founds the same backpack and sends a link to his friend. The last one welcomes the choice, however, the customer decides to wait for the salary.
- “N” adds the website to bookmarks and only at the beginning of the next month he goes there to make a purchase. In this example multi-channel funnels would look like that: cpc (paid ads) — free search — direct (transfer by direct link).
Why do you need this report? Imagine that an online store holder based on other reports would decide that paid ads are useless and would opt them out. Not considering that hiking equipment requires the detailed select, that’s why visitors rarely buy it at once. They usually reflect on the purchase for some time. Nevertheless, paid ads are already opt-out and sales are going down. A chain has lost the key link that brought customers to the website.
If you don’t want to make the same mistakes — analyze the report on multi-channel funnels. It shows the combinations of channels that drive traffic to the website. When you see that a specific flow generates a lot of proper conversions, it means that you can’t opt-out any channel in it. This report is important for a PPC Specialist as it shows the value of paid channels in combination with other traffic sources. You can also choose goals for multi-channel funnels and see the number of conversions made by them.

Conclusions
Advertisements in e-commerce require particular analytics. Let’s conclude what do you need to evaluate the contextual advertising efficacy without the e-commerce module:
- analyze reports every week;
- make global decisions on ad campaigns success after a month or two — it depends on traffic;
- rely on key metrics that are described above.
Text us if you have any questions and we will share our experience of Ringostat website contextual advertising efficacy analysis.