

This guide is for those who work with data in Google Spreadsheets. It will be especially useful for small business owners and sales reps — if their KPIs are related to call handling. Thanks to this upload, it will be easier for you to evaluate the department’s efficiency. Also, in this article, you will find query templates suitable for most companies. You will only need to insert your own parameters.
The call log and its reports are convenient tools for everyday work. All data is placed in chronological order so you can easily keep track of the current situation. You can analyze whether the new ads have started running and generated how many calls, how employees handle calls, etc.
However, some companies summarize their work and calculate KPIs in Google Spreadsheets. For example, they make a monthly report and count the number of calls for a specific period and which managers received them. We will tell you how to automatically upload the necessary data directly into tables, especially for them.
This article will break down the general customization principle and give two examples.
- Download data on calls for a specific period. For example, if you need to see the number of all calls or see which sales rep handled the most calls, calculate how many were outgoing, received, missed, etc.
- All calls for the last week. If the department usually summarizes the results for that time period.
- Unloading by missed calls. Allows you to see how many calls each manager has missed — which will help to improve discipline in the department.
Now, let’s move on to step-by-step instructions on how to do this. Please note that this is just an example of the data that can be uploaded. Ringostat allows you to customize everything as flexibly as possible, so you can choose other parameters if you need to.
Getting Ringostat API
The Ringostat API is the functionality that allows you to use our service’s data in third-party products. It helps set up integration with CRM, Google Analytics, and other systems.
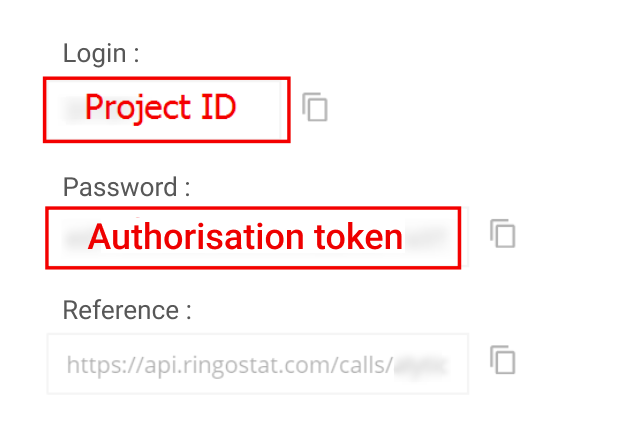
To get it, go to your personal account and in the menu on the left, select any platform in the Integrations section, and Copy the Project ID and token from there.
Customizing the table
Create a new Google sheet. To speed up this process, just type sheet.new in the search bar. Depending on our tasks, you should add a query to upload data.
An example of the structure of a request to export calls for a week:
https://api.ringostat.net/calls/list?
?auth=token authorisation
&export_type=json
&from=2018-05-01%2000:00:00
&to=2018-05-08%2023:59:59
&fields=calldate,caller,dst,disposition,billsec,utm_source,utm_medium,recording
Let’s break down the structure in a little more detail:
- https://api.ringostat.net/calls/list — the address to send the request to;
- project_id= — project identifier in Ringostat, which we copied above;
- &token= — authorization key in the project;
- &export_type — upload format, can be json or csv;
- &from= — starting from which date the data will be uploaded, the time is also set here;
- &to= — by what date and time;
- &fields= — parameters that will be uploaded, the example above shows the call date, caller number, which number was called, call status, call duration, source, channel, and audio recording;
- &order= — sorting.
You can set any other fields or complicate the query, for example, by setting sorting. The article from the knowledge base about Ringostat API describes how to do it.
Example of a query for uploading call data for a specific period
Stand on cell A1 and copy the query below. It is important to enter the formula exactly in one cell without stretching it. Please specify your Project ID and token — now these figures are randomized, just for the sake of example.
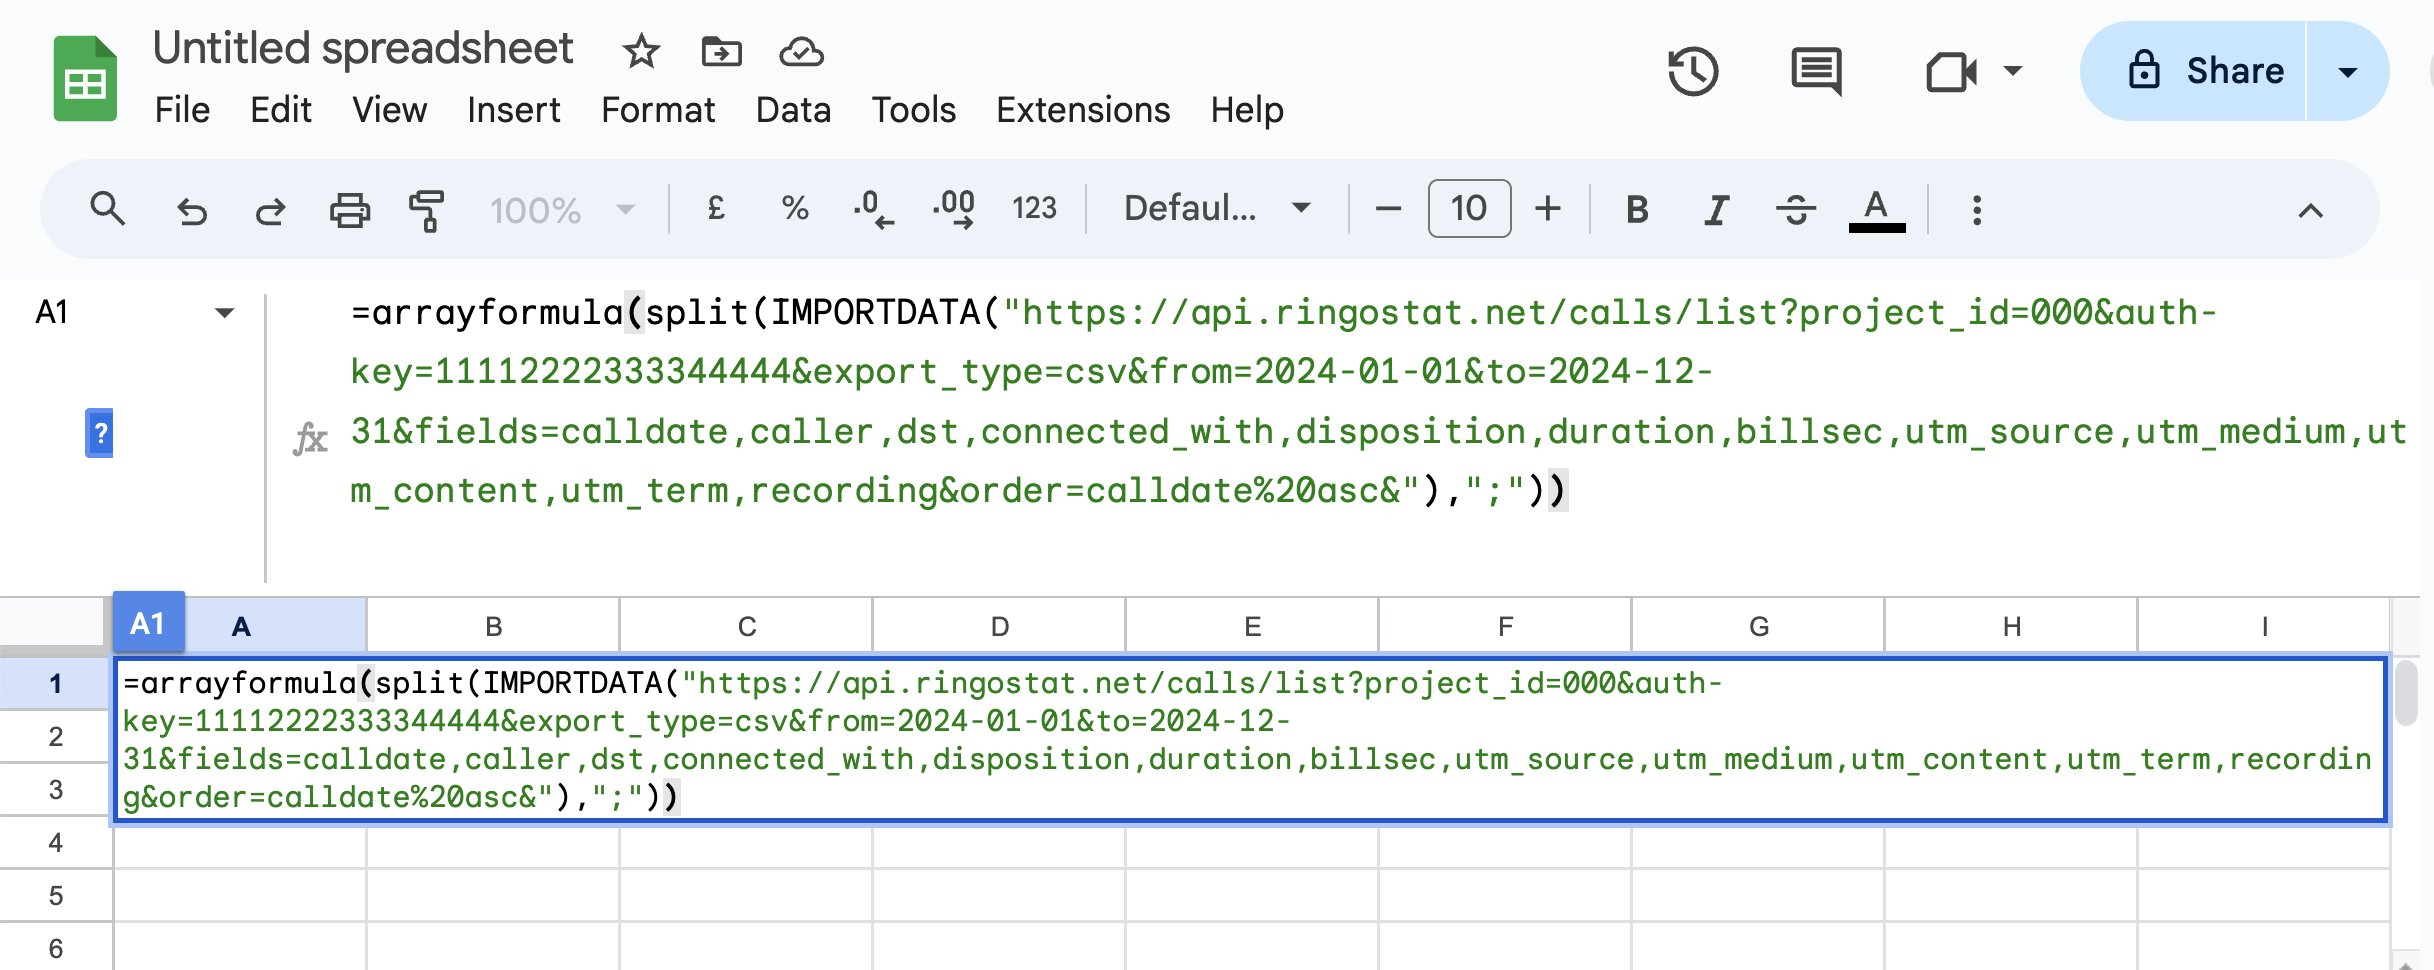
You should also change the dates in the query to the period you are interested in. In this case, the changes are made in the from and to fields.
The query must be specified on the line in a single array with no gaps.
=arrayformula(split(IMPORTDATA("https://api.ringostat.net/calls/list?project_id=000&auth-key=11112222333344444&export_type=csv&from=2024-01-01&to=2024-12-31&fields=calldate,caller,dst,connected_with,disposition,duration,billsec,utm_source,utm_medium,utm_content,utm_term,recording&order=calldate%20asc&"),";"))IMPORTANT: The above formula is valid for Google documents with English locale. If the formula doesn’t work, check if you have the appropriate locale set in the Toolbar — File — Settings — General — Language. If you have a different locale set, change the punctuation mark at the end of the formula — there should be a semicolon instead of a comma.
We have added parameters: call date, caller number, number called, number called, who connected, status, duration of waiting + call, separate call duration, source, channel, ad content, keyword, and call recording. This way, the upload will be as informative as possible.
Example query for uploading call data for the last week
The formula is much like the one above. But there is an element in it which is responsible for pulling the weekly data automatically:
from="&text(TODAY()-8,"YYYY-MM-DD")&"%2000:00:01&to="&text(TODAY()-1,"YYYY-MM-DD"The formula “subtracts” one day and eight more days from today’s date to make a week. The data for the current day is not included here. The whole formula looks like this:
=arrayformula(split(IMPORTDATA("https://api.ringostat.net/calls/list?project_id=000&token=d000bc0000de00abcd000efgh0i00g00&export_type=csv&from="&text(TODAY()-8,"YYYY-MM-DD")&"%2000:00:01&to="&text(TODAY()-1,"YYYY-MM-DD")&"%2010:00:00&fields=calldate,caller,dst,connected_with,disposition,duration,billsec,utm_source,utm_medium,utm_content,utm_term,recording&order=calldate%20asc&"),";"))Example of a query for downloading data on missed calls
To ensure that only calls with a certain status are included in the table, you should additionally use a filter. In our example, these are missed calls, but you can choose any other status — answered, targeted, repeat, etc.
As in the previous paragraph, the above query pulls data for the last seven days. But you can also specify a specific period, as in the first example. The whole formula looks like this and includes a variable for the disposition field:
=arrayformula(split(IMPORTDATA("https://api.ringostat.net/calls/list?project_id=000&token=d000bc0000de00abcd000efgh0i00g00&export_type=csv&from="&text(TODAY()-8,"YYYY-MM-DD")&"%2000:00:01&to="&text(TODAY()-1,"YYYY-MM-DD")&"%2010:00:00&fields=calldate,caller,dst,disposition,duration,billsec,pool_name,utm_source,utm_medium,utm_content,utm_term,recording&order=calldate%20asc&&filters=disposition~Tk8gQU5TV0VSfEZBSUxFRHxOTy1GT1JXQVJEfEJVU1k,call_type=in"),";"))After you enter any of the three queries above and refresh the page, the data should pull up immediately. You’ll see something like this, except on the right side, there will be a column with a link to audio recordings for each call — unless it’s a missed call:
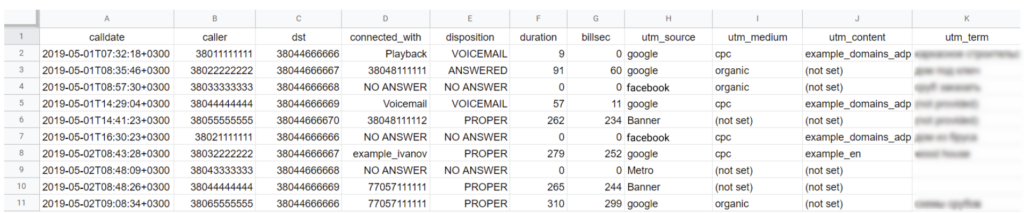
You just need to go to the table to get the latest data for the second and third examples. To unload calls for a specific period — you need to go to cell A1 and change the dates manually in the fragment:
&from=2019-05-01&to=2019-05-31
What’s next?
You get a table with “raw” data unloading, which you can use to work further at your discretion. Here are just a few options.
- Export a part of the data you are interested in to a neighboring sheet and build graphs and charts.
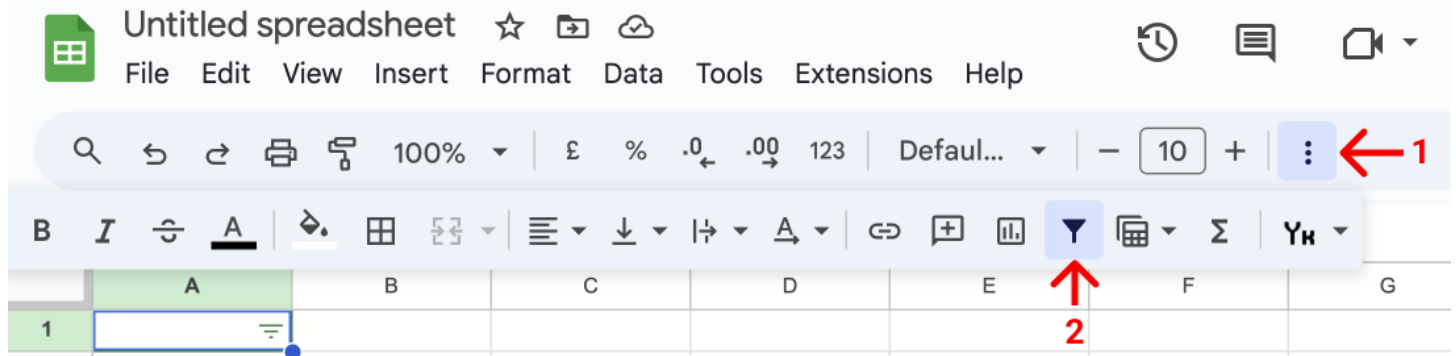
- Set up a filter system to sort data by specific metrics.
- Add sheets for individual employees to the document. Using filters and the IMPORTRANGE formula, transfer information about calls received by each manager there. This will help you see the entire volume of calls an employee handles.
If you want to know more about the last point or have any questions, write to us in the comments.