Your campaign has been working steadily, and you haven’t made any changes, but at one point, your CPC and daily costs have increased dramatically, or vice versa. This happens quite often, as Google Ads ads work according to the auction procedure. Therefore, to understand why this happened, you need the “Auction Insights” report. Diana Pavlova, the PPC specialist at Ringostat, tells us where to view the report, how to understand the main metrics, and how to use the data to improve your advertising campaigns.
How does the auction work?
Before we get to the report, I’d like to remind you of the principle of the auction in the ads system.
An auction is a procedure during which the system determines which ads will be shown in search results, on which pages, in what order, and whether they will be shown at all. The auction is influenced by five main factors:
- your bid;
- quality of ads;
- predicted impact of objects and other ad formats;
- ad rating;
- ad context.
Each user’s search query on Google is an opportunity to show relevant ads. There are 7 advertising spots on search pages: 4 at the top and 3 at the bottom. To distribute these spots among advertisers, the system analyzes each ad in real-time. That is, every time your ad goes up for auction, it competes with competitors’ ads for a place in the sun.
The “Auction Insights” report will help you find out your current position compared to other advertisers and improve the effectiveness of your advertising.
“Auction Insights”, what is this report?
“Auction insights” is a report that shows the effectiveness of your ads compared to competitors who participate in the same auctions as you. This report provides you with important information for analysis, which will help you set bids and allocate your campaign budget more efficiently.
In which campaigns the report is available
The Auction Insights report is available for:
- search campaigns;
- regular trading campaigns generated based on data from the search network;
- campaigns with maximum efficiency — Performance Max, about which you can read the article.
Auction statistics can be viewed in search campaigns not only at the campaign level but also at the level of ad groups and keywords. For shopping campaigns — by campaigns and ad groups. For the highest performing campaigns — by the campaign.
This report is available only for those campaigns that have an impression share on the search network of more than 10%. The report can also be accessed for ad groups and keywords only when a sufficient number of user actions have been registered. That is, the impression share must be at least 10%.
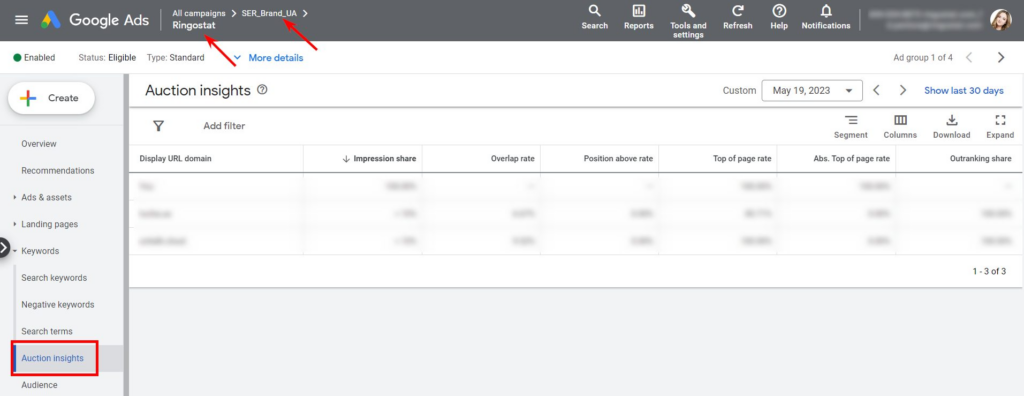
1. For search campaigns
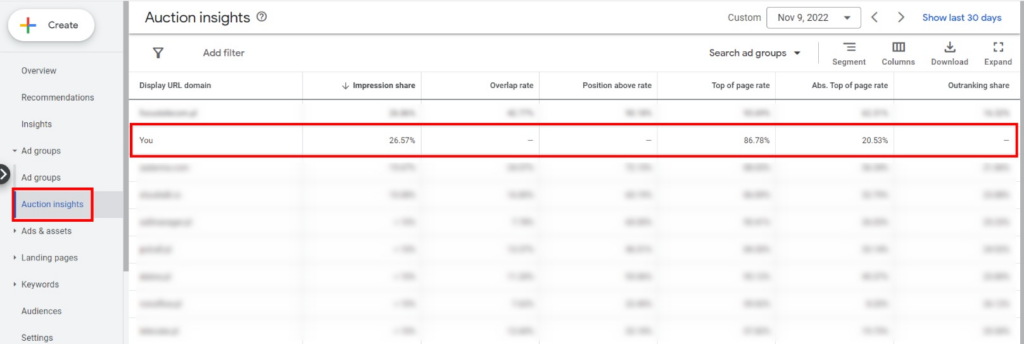
To view the campaign report, click on the desired campaign in your account and select “Auction statistics” in the “Ad group” section.

To view statistics for a group of ads, click on the desired group and select “Auction Insights” in the “Keywords” section.
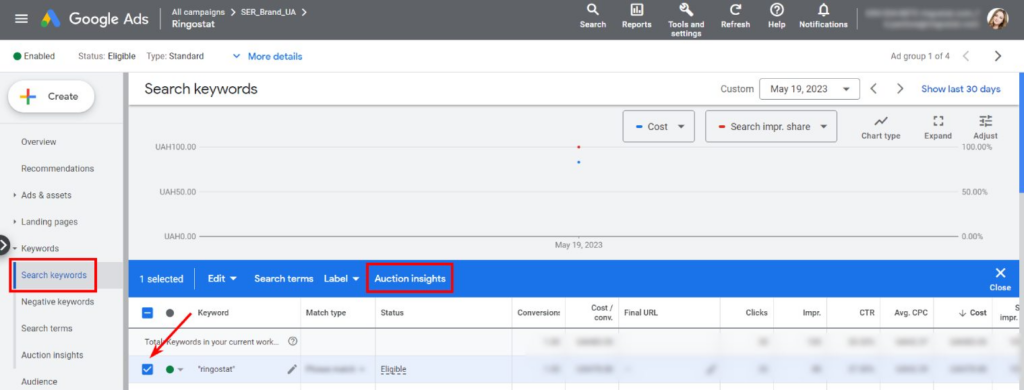
To view the keyword statistics in the corresponding section, check the box next to the desired keyword and click “Auction Insights”.
You will see the data for a specific keyword here.

2. For sales campaigns
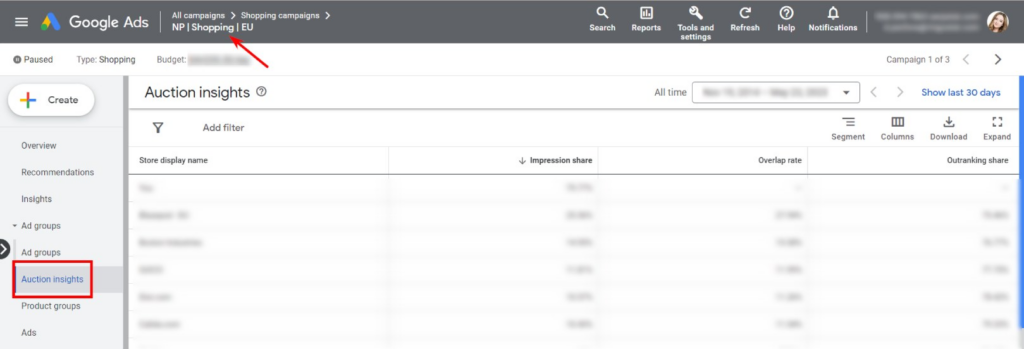
To view a campaign report, click on the desired campaign in your account and select “Auction Insights” in the “Ad Group section”.
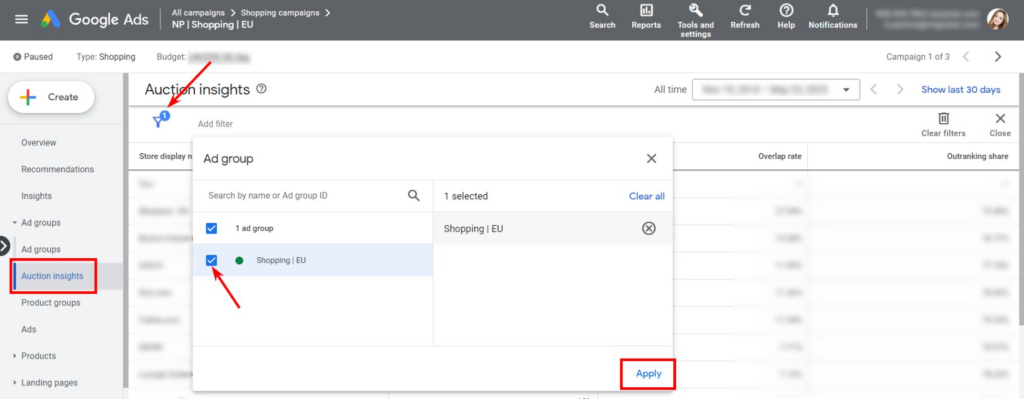
You need to click on the filter on the same page to view statistics for the ad group. After that, select the required ad group and click “Apply”.
3. For Performance Max campaigns
To view the campaign report, click on the desired campaign in your account and select “Auction Insights” in the “Statistics” section.

Key indicators of the report
- Impression share. This metric is a comparison of your actual number of impressions with the potential number of impressions, i.e. the total number of available impressions. For example, if your ad was viewed 1000 times and there are 10,000 available impressions, your share is 10%.
- Crossover rate. This indicator shows how often your competitor’s ads were shown simultaneously with yours. For example, if the indicator is 20%, your competitor’s ads were displayed twice for every ten impressions of your ad.
- Percentage of wins. This shows how often your ad was ahead of the competitor’s.
- The coefficient for the position above: is available only for search campaigns. This metric displays how often your competitor’s ad appeared above where you both received impressions at the same time.
- Frequency of impressions above search results: available for search campaigns only. Here you’ll find out how often your ad, or your competitor’s, depending on which row you’re viewing, appeared at the top of the paid search rankings.
- Impression shares on the very first position: available only for search campaigns. This metric shows how often an ad, yours or a competitor, depending on which row you are viewing, was displayed at the top of the page as the very first ad.
How to use the “Auction Insights” report to improve your advertising campaigns
Understanding your competitors
First of all, this report is useful because it shows you the activity of your competitors. You can identify your main competitors and conduct research on them. For example, analyze their ads, USPs, websites, pricing, etc. And use this data for your own promotion.
Quite often, this report will help you find new competitors that you didn’t know about for one reason or another. For example, if they have just started promoting themselves.
You will also understand which of your competitors is the most “aggressive”, targeting your brand. This will help you in your promotion.
Optimization of budgets and rates
Many advertisers are interested in how much their competitors spend on advertising. You won’t know the exact figure, but the “Auction Insights” report will give you a rough idea.
Pay attention to the important indicator “Impression share”. This is the number of impressions received on the search engine divided by the estimated number of impressions you could have received.
For example, the search query “virtual PBX” was searched 100 times yesterday, and an ad about it was shown 30 times for this query. So the share of impressions in the search network will be 30%. This is only a conditional example, as the system takes into account some other factors when calculating.
The higher this figure is, the more often your ad is included in the auction, and the more traffic you buy. This directly affects campaigns. Because if there is not enough traffic and conversions for optimization, campaigns will not be able to work effectively.
If there is no data on your campaign because the share of impressions on the search engine is less than 10%, this indicates that your bids are too low and/or you are not spending enough.

Your competitors spend much more on advertising. So, you need to increase your budget and rates. The same report will also be useful to understand how much you need to do this.
Usually, experts prepare a media plan that shows the number of possible requests, CPC, CTR, and the required budget before launching campaigns. But the media plan is usually approximate, or it doesn’t exist at all. This is where the “Auction Insights” report comes in handy. The data on the “Impressions share” indicator is updated daily. Therefore, you can analyze what percentage of searches are made up of certain costs.
This can be done manually by viewing the report separately for each day:
Or you can display the cost and impression share on the search engine network on a chart. And you can see how the impression share grows with increasing costs:

After analyzing this data, you will understand what the costs should be to get a certain percentage of impressions.
Targeting optimization
The report can be very useful for optimizing Performance Max campaigns. In addition to the above, it will help you understand whether the campaign has been trained correctly and whether it is being shown to the target audience.
You cannot set keywords for targeting in Performance Max. The system chooses which search queries to show ads for based on the signals from the audiences and objects you added when setting up the group. The data you need is again available in the “Auction Insights” section:

If you see advertisers among your competitors that are remotely related to your topic, your campaign is probably optimized based on incorrect signals. It is worth reviewing the signals of your audiences, analyzing your ads, banners, and videos, and optimizing them.
It’s also a good idea to make sure that people understand your ads correctly and that they don’t mislead anyone about your products or services. For this purpose, audio recordings of conversations with people who never became customers are a very convenient tool. Such recordings are made by virtual telephony.
Listen to what people ask and what they say, for example: “I understood from your advertisement, that you sell A, but it turned out that you sell B.” This will help you refine your ad copy, optimize your targeting, and change your banners.
Similarly, it will be useful for search campaigns. If you see near-target competitors or even non-target competitors, you should reconsider:
- your keywords;
- their types of relevance;
- search queries for which they are shown.
Perhaps you are using untargeted keywords that should be stopped. Or maybe broad match brings in untargeted queries that should be added to the negative keywords. Or it’s better to switch your keywords to phrase matching if there are a lot of such queries.
Conclusions
- The “Auction Insights” report will show your current position compared to your competitors and help you improve the effectiveness of your own advertising.
- The report is available:
- for search campaigns: at the campaign, ad group, and keyword levels;
- regular shopping campaigns: at the level of companies and ad groups;
- Performance Max campaigns: at the campaign level.
- The report data will be useful for better understanding your competitors and improving your own advertising based on other advertisers’ promotion strategies.
- You will immediately realize that you should raise your bids and increase your promotion budget if the report is empty because the share of impressions of your ads is below 10%. This means that your competitors are spending much more. The report will help you understand how much you need to increase your bids and/or budgets.
- The report will help you understand whether the Performance Max campaign has learned correctly and whether your ads are being seen by the target audience. And whether you are using the right keywords in your search campaigns.

