

Time matters. Time is a priceless treasure. Probably, you heard it a lot of times. The same things work with your call center and sales department. If you don’t distribute the call center volume properly, you just throw spaghetti at the wall hoping it sticks. (I promise my metaphors will get better). Okay, you think. So how to optimize the sales process? How to ensure that call agents are concentrated on their work in the rush hour? In this post, we’ll cover how to leverage call distribution report and effectively manage the time of your call center.
If you’re a newbie in using Ringostat, we recommend you collecting baseline data for making the conclusion. It’s possible after 2-3 weeks of using call tracking.
Let’s begin from data visualization. In our reports, you may view call distribution by day of the week and time of the day for the specified period.
You can analyze two kinds of reports — total and average. The first option shows how many calls you received for the specified period, the second option displays the average number of calls per day or hour.
Let’s take a look at the example.
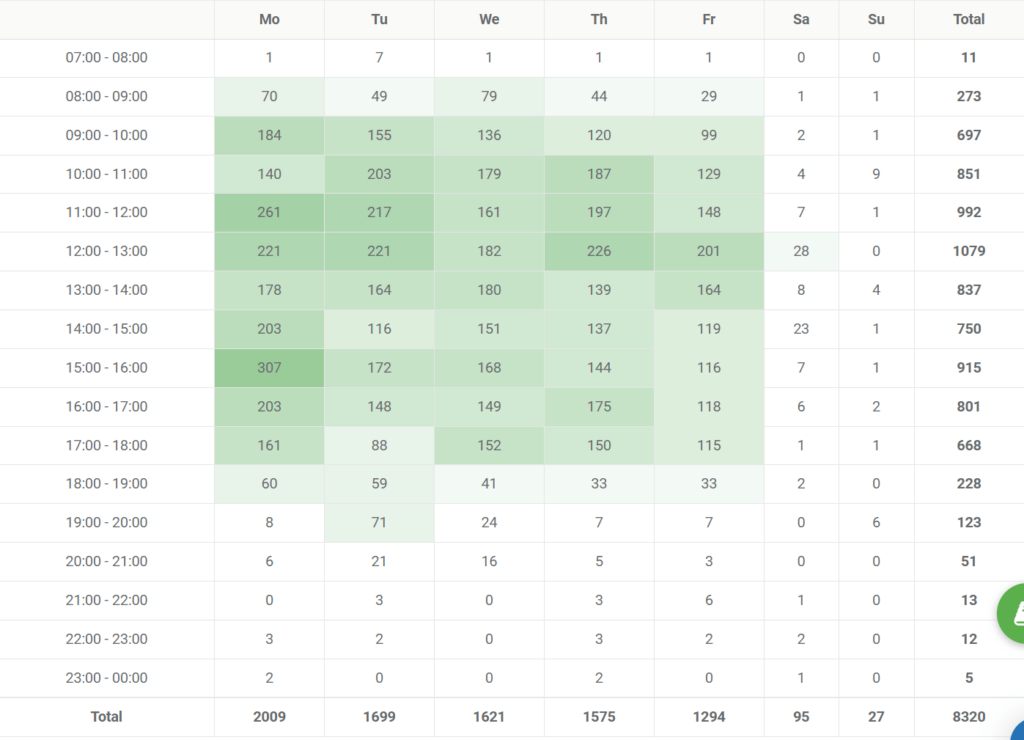
As you see, the busiest days are Monday, Tuesday and Thursday. The most calls come from 9 AM to 6 PM.
Also, this table shows that on Fridays call managers get the lowest number of calls.
Why is it important? Because it gives you the understanding at what time the sales managers should be the most focused and when they can concentrate on other tasks.
Basing on these reports, you can build a motivation system for sales managers and do your best to prepare the call center for the rush hour.
Call distribution by day of week
This chart shows the call distribution per week.
Thanks to this graph, you don’t need to manually calculate the number of calls per week. Also, it helps understand how to distribute the shifts of call agents more efficiently.
Call distribution by time of the day
This сhart lets you see rush hours in the call center. For example the number of calls grows from 9 AM and reaches a peak at 12 AM – 1 PM. Thus, you may determine the most active phases of working day and schedule the lunch break at 2 PM, because at this time the number of calls is usually low.